
WTI prices remained relatively unchanged since last week’s oil report. In the current report we intend to have a look at the state of the US wti market, Iraq’s commitment to OPEC’s production cuts, and the difference in global oil demand forecasts between the IEA and OPEC. To conclude the report we will also provide a technical analysis of WTI’s daily chart.
Mixed signals for the US oil market
The metrics related to the US oil market tended to provide mixed signals since our last report. Characteristically the Baker Hughes oil rig count for the prior week, dropped by three active oil rigs, from 499 to 496, in a sign of easing oil demand in the US oil market. Yet, that appears to have been contradicted, as on Tuesday the API weekly crude oil inventories figure was released, which showcased a decrease of US oil inventories by minus three point one zero four million barrels.
Moreover, the release of the EIA crude oil inventories report was also indicative of a drawdown in oil inventories by minus two point five zero eight million barrels. The drawdown was much greater than expected, implying that oil demand from US consumers over the past week has increased, which in turn may have provided support for oil prices.
Overall, the release of the EIA and API weekly crude oil inventories figures seemed to contradict the signals sent by the reduction in the Baker Hughes oil rig count of easing oil demand in the US. Therefore we see the indicators continue aligning in the coming week as well, hence implying an increase in demand from the US oil market we may see WTI’s price getting a boost.
Iraqi commitment to OPEC+ production cuts continues to be a mystery.
According to various media outlets, Iraqi’s oil minister stated this past Saturday that Iraq has made enough voluntary oil production reductions and would not agree to any additional cuts taken by OPEC+. In particular, the Iraqi oil minister Ghani when discussing production, stated per Reuters that “Iraq has reduced enough and will not agree to any new cut”. The Iraqi oil minister does not appear to have clarified as to whether or not his comments were referring to OPEC’s current voluntary oil production cuts, or as to whether they would oppose a further reduction in output.
The statements made by the minister appear to be indicative of a growing rift between OPEC nations, which are set to meet on the 1 of June for their meeting. Furthermore, in a recent report by Bloomberg, the rift is once again highlighted, as it is claimed that several major exporters are seeking to have their oil productions levels upgraded.
Therefore, with differing agendas appearing to divide OPEC+, the group’s voluntary oil production cut may be on the chopping bloc. Hence with the most recent developments and the apparent unwillingness by some nations to further reduce supply it could mitigate the desired impact by OPEC to drive oil prices and instead could weigh on the liquid gold’s price. Nonetheless, we remain vigilant about any developments regarding OPEC+ nations, as the bloc’s meeting nears.
IEA and OPEC at odds over demand forecasts’
According to Reuters, the International Energy Agency on Wednesday reduced its forecast for the 2024 oil demand growth. Hence placing the agency at odds with OPEC in terms of oil demand expectations for the rest of the year. In particular, the IEA claims that global oil demand this year will grow by 1.1 million barrels per day, which is down by one hundred and fourty thousand barrels per day from their previous forecast. In contrast, OPEC in its monthly report on Tuesday, stuck to its expectations that global wti demand will rise by 2.25 million barrels per day in 2024. Therefore, the disparity in global oil demand forecasts may have led to increased volatility in the market, as market participants appear uncertain, as to who they should listen to. In conclusion, it would appear that the disparity in the two reports, may have canceled out each other’s impact on oil prices. In particular, the OPEC report may have provided some support for oil prices, whilst the IEA’s report may have weighed on the liquid gold’s price
技术分析
WTI Cash Daily Chart
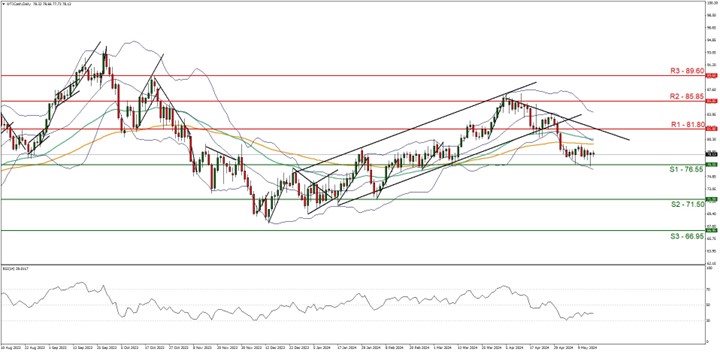
- Support: 76.55 (S1), 71.50 (S2), 66.95 (S3)
- Resistance: 81.80 (R1), 85.85 (R2), 89.60 (R3)
WTI’s price appears to have floated just above the seventy six point fifty five support line since the 2 of May. Nonetheless, we maintain a bearish outlook for the commodity’s price and supporting our case is the downwards-moving trendline which was incepted on the 5 of May, in addition to the RSI indicator below our chart which currently registers a figure near 40, implying bearish market tendencies.
Furthermore, the Bollinger bands appear to be tilted to the downside, which may also imply bearish market tendencies. For our bearish outlook to continue, we would require a clear break below the seventy six point fifty five support level, with the next possible target for the bears being seventy one point fifty support line.
On the flip side for a sideways bias we would require the commodity’s price to remain within the sideways moving channel defined by the seventy six point fifty five support level and the eight one point eighty resistance line. Lastly, for a bullish outlook we would require a break above the eighty one point eighty resistance line with the next possible target for the bulls being the eighty five point eighty five resistance ceiling.
免责声明:
This information is not considered investment advice or an investment recommendation, but instead a marketing communication. IronFX is not responsible for any data or information provided by third parties referenced or hyperlinked, in this communication.
