
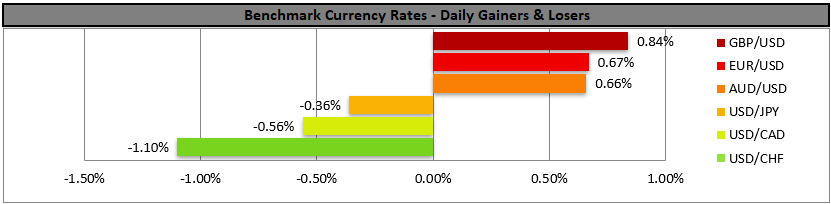
Ceasefire Deal hopes seem to remain, supporting improved risk sentiment across global markets and weighing further on the US dollar.
Investors continued to abandon the greenback for a sixth straight session, as expectations for a more permanent diplomatic breakthrough in the Middle East revived confidence and boosted demand for riskier assets.
With few major US economic releases scheduled this week, market attention is likely to remain focused on geopolitical headlines and the Federal Reserve’s next policy signals.
USD takes another dive
The USD was on retreat in the FX market as investors tended to abandon the safe-haven instrument. Revived market hopes for a possible more permanent ceasefire deal in the Middle East sent the greenback in the reds for a sixth day in a row, yesterday.
It’s expected to be a rather easy-going week given the low number of high-impact financial releases from the US in the calendar, and we expect fundamentals with the developments in the war in Iran and the Fed’s intentions to sway the market’s mood.
US equities on the rise
US equities benefited from the improved market sentiment, given the elevated hopes for a diplomatic breakthrough in the war in Iran. Should the market mood improve further, we may see US equities gaining further ground.
We also highlight the release of earnings reports this week, with Goldman Sachs having already released its report yesterday and we expect JP Morgan, Citigroup today and Bank of America and Morgan Stanley tomorrow. We also note JNJ today and Netflix and Pepsi on Thursday.
Oil prices retreat
Despite oil prices opening higher yesterday, market hopes for a possible further de-escalation in the Middle East forced a correction lower.
The Straits of Hormuz are currently being blockaded by the US, and despite a breakdown of negotiations over the weekend, we expect another round in the coming days.
Should we see market hopes for a ceasefire in the Middle East being enhanced, we may see oil prices losing further ground and vice versa.
Gold’s price remains stable, while Bitcoin gains
Gold’s price remained relatively stable, seeming unable to benefit materially from the weakening of the USD in the past few days.
On the other hand, though, Bitcoin’s price got some support as the improved market sentiment provided tailwinds for the crypto market, given its riskier nature.
Other highlights for today
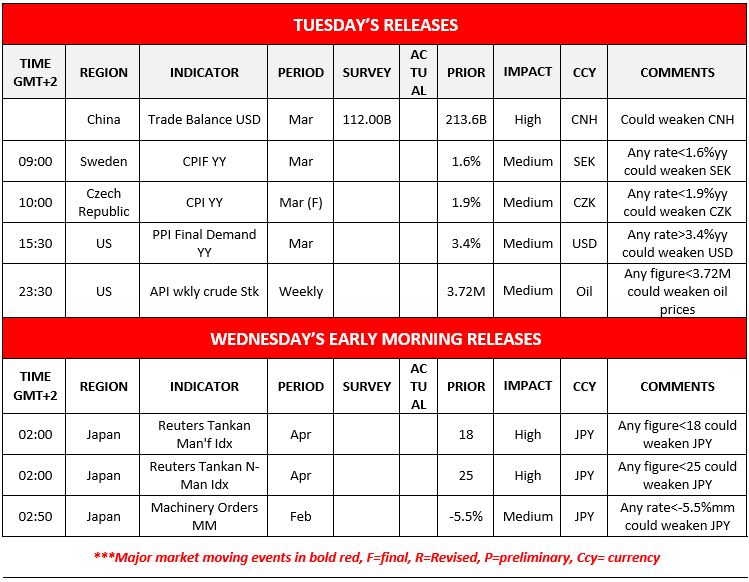
Today we get Sweden’s and the Czech Republic’s CPI rates for March, the US PPI rates for March and the weekly US API crude oil inventories figure.
In tomorrow’s Asian session, we get Japan’s Tankan indexes for April and machinery orders for February.
Charts to keep an eye out
WTI’s
The gains made for oil prices at yesterday’s opening were erased with WTI’s price remaining well between the 100.90 (R1) resistance line and the 93.80 (S1) support level.
Given that the RSI indicator continues to run along the reading of 50, implying a rather indecisive market, we maintain a bias for a sideways motion of WTI’s price, while at the same time we warn for any possible bearish tendencies.
Should the bears lead WTI’s price action lower, we expect the movement to be marked by a breaking of the 93.80 (S1) line and an effort to reach if not breach the 87.10 (S2) level.
Should the bulls take over, which seems unlikely yet remains a possibility, we may see WTI’s price breaking the 100.90 (R1) line and start aiming for the 107.00 (R2) level.
USD/CHF
The weakening of the USD in the FX market was quite evident in the drop of USD/CHF with the pair’s price swaying from the 0.7920 (R1) resistance line and bouncing on the 0.7815 (S1) support line.
We consider the slight upward movement of the pair in today’s Asian session as a correction and maintain a bearish outlook for the pair given also that the RSI indicator remains below the reading of 50, implying a bearish predisposition of the market for the pair.
Should the bears remain in charge, we may see USD/CHF breaking the 0.7815 (S1) support line and start aiming for the 0.7745 (S2) support level.
Should the bulls take over, we may see USD/CHF breaking the 0.7920 (R1) line and start aiming for the 0.8040 (R2) level.
WTI Daily Chart
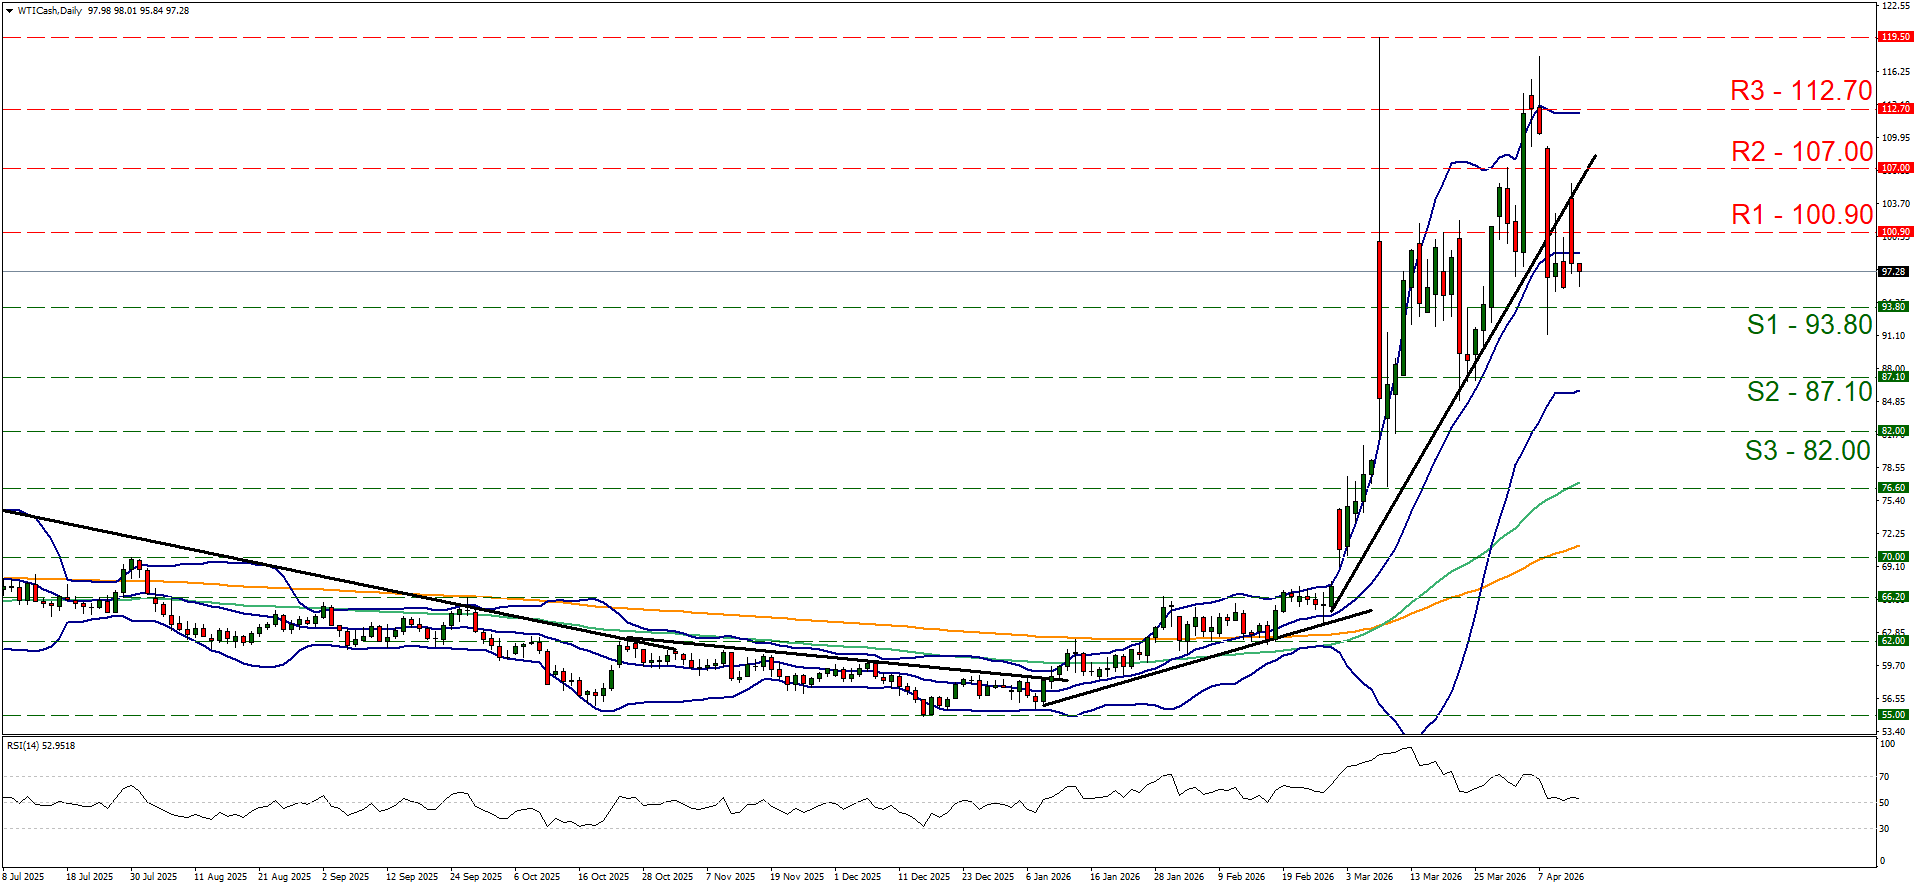
- Support: 93.80 (S1), 87.10 (S2), 82.00 (S3)
- Resistance: 100.90 (R1), 107.00 (R2), 112.70 (R3)
USD/CHF Daily Chart
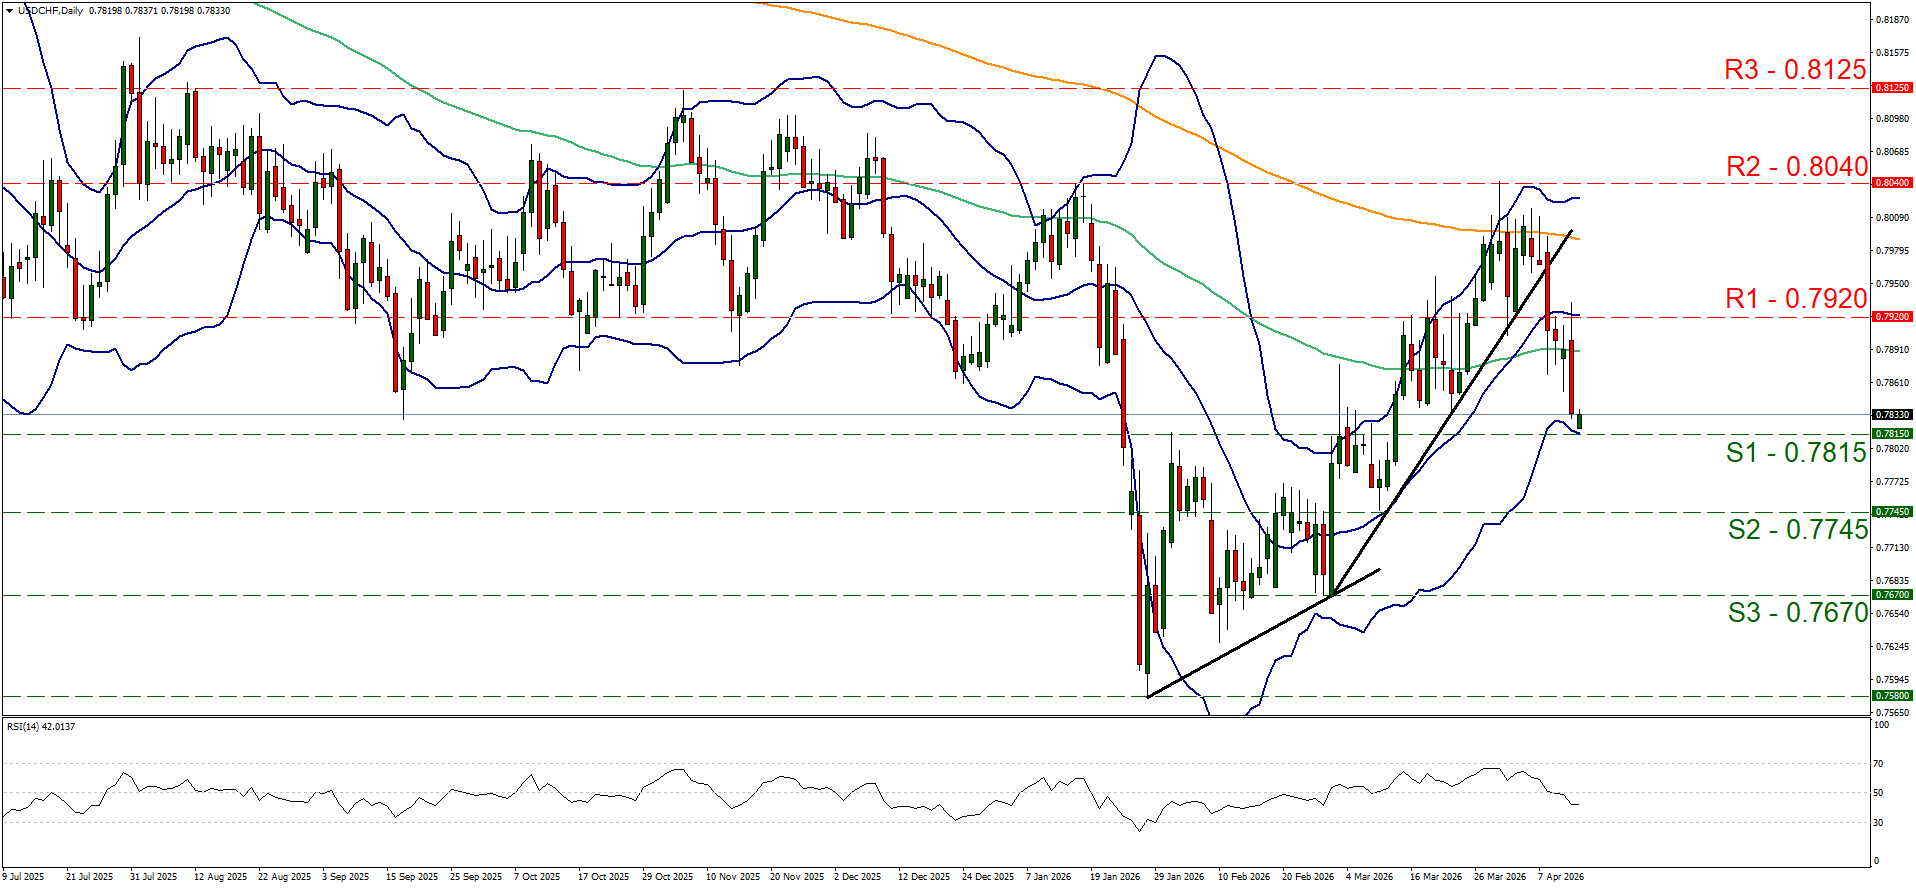
- Support: 0.7815 (S1), 0.7745 (S2), 0.7670 (S3)
- Resistance: 0.7920 (R1), 0.8040 (R2), 0.8125 (R3)
Disclaimer:
This information is not considered as investment advice or an investment recommendation, but instead a marketing communication. IronFX is not responsible for any data or information provided by third parties referenced, or hyperlinked, in this communication.