
Markets seem to hesitate at the start of the week, with FX pairs trading in narrow ranges and risk appetite remaining fragile.
With limited top-tier US data releases today, attention shifts to geopolitical developments and upcoming macro events, including Australia’s March CPI figures, which could influence expectations around the RBA’s next policy move.
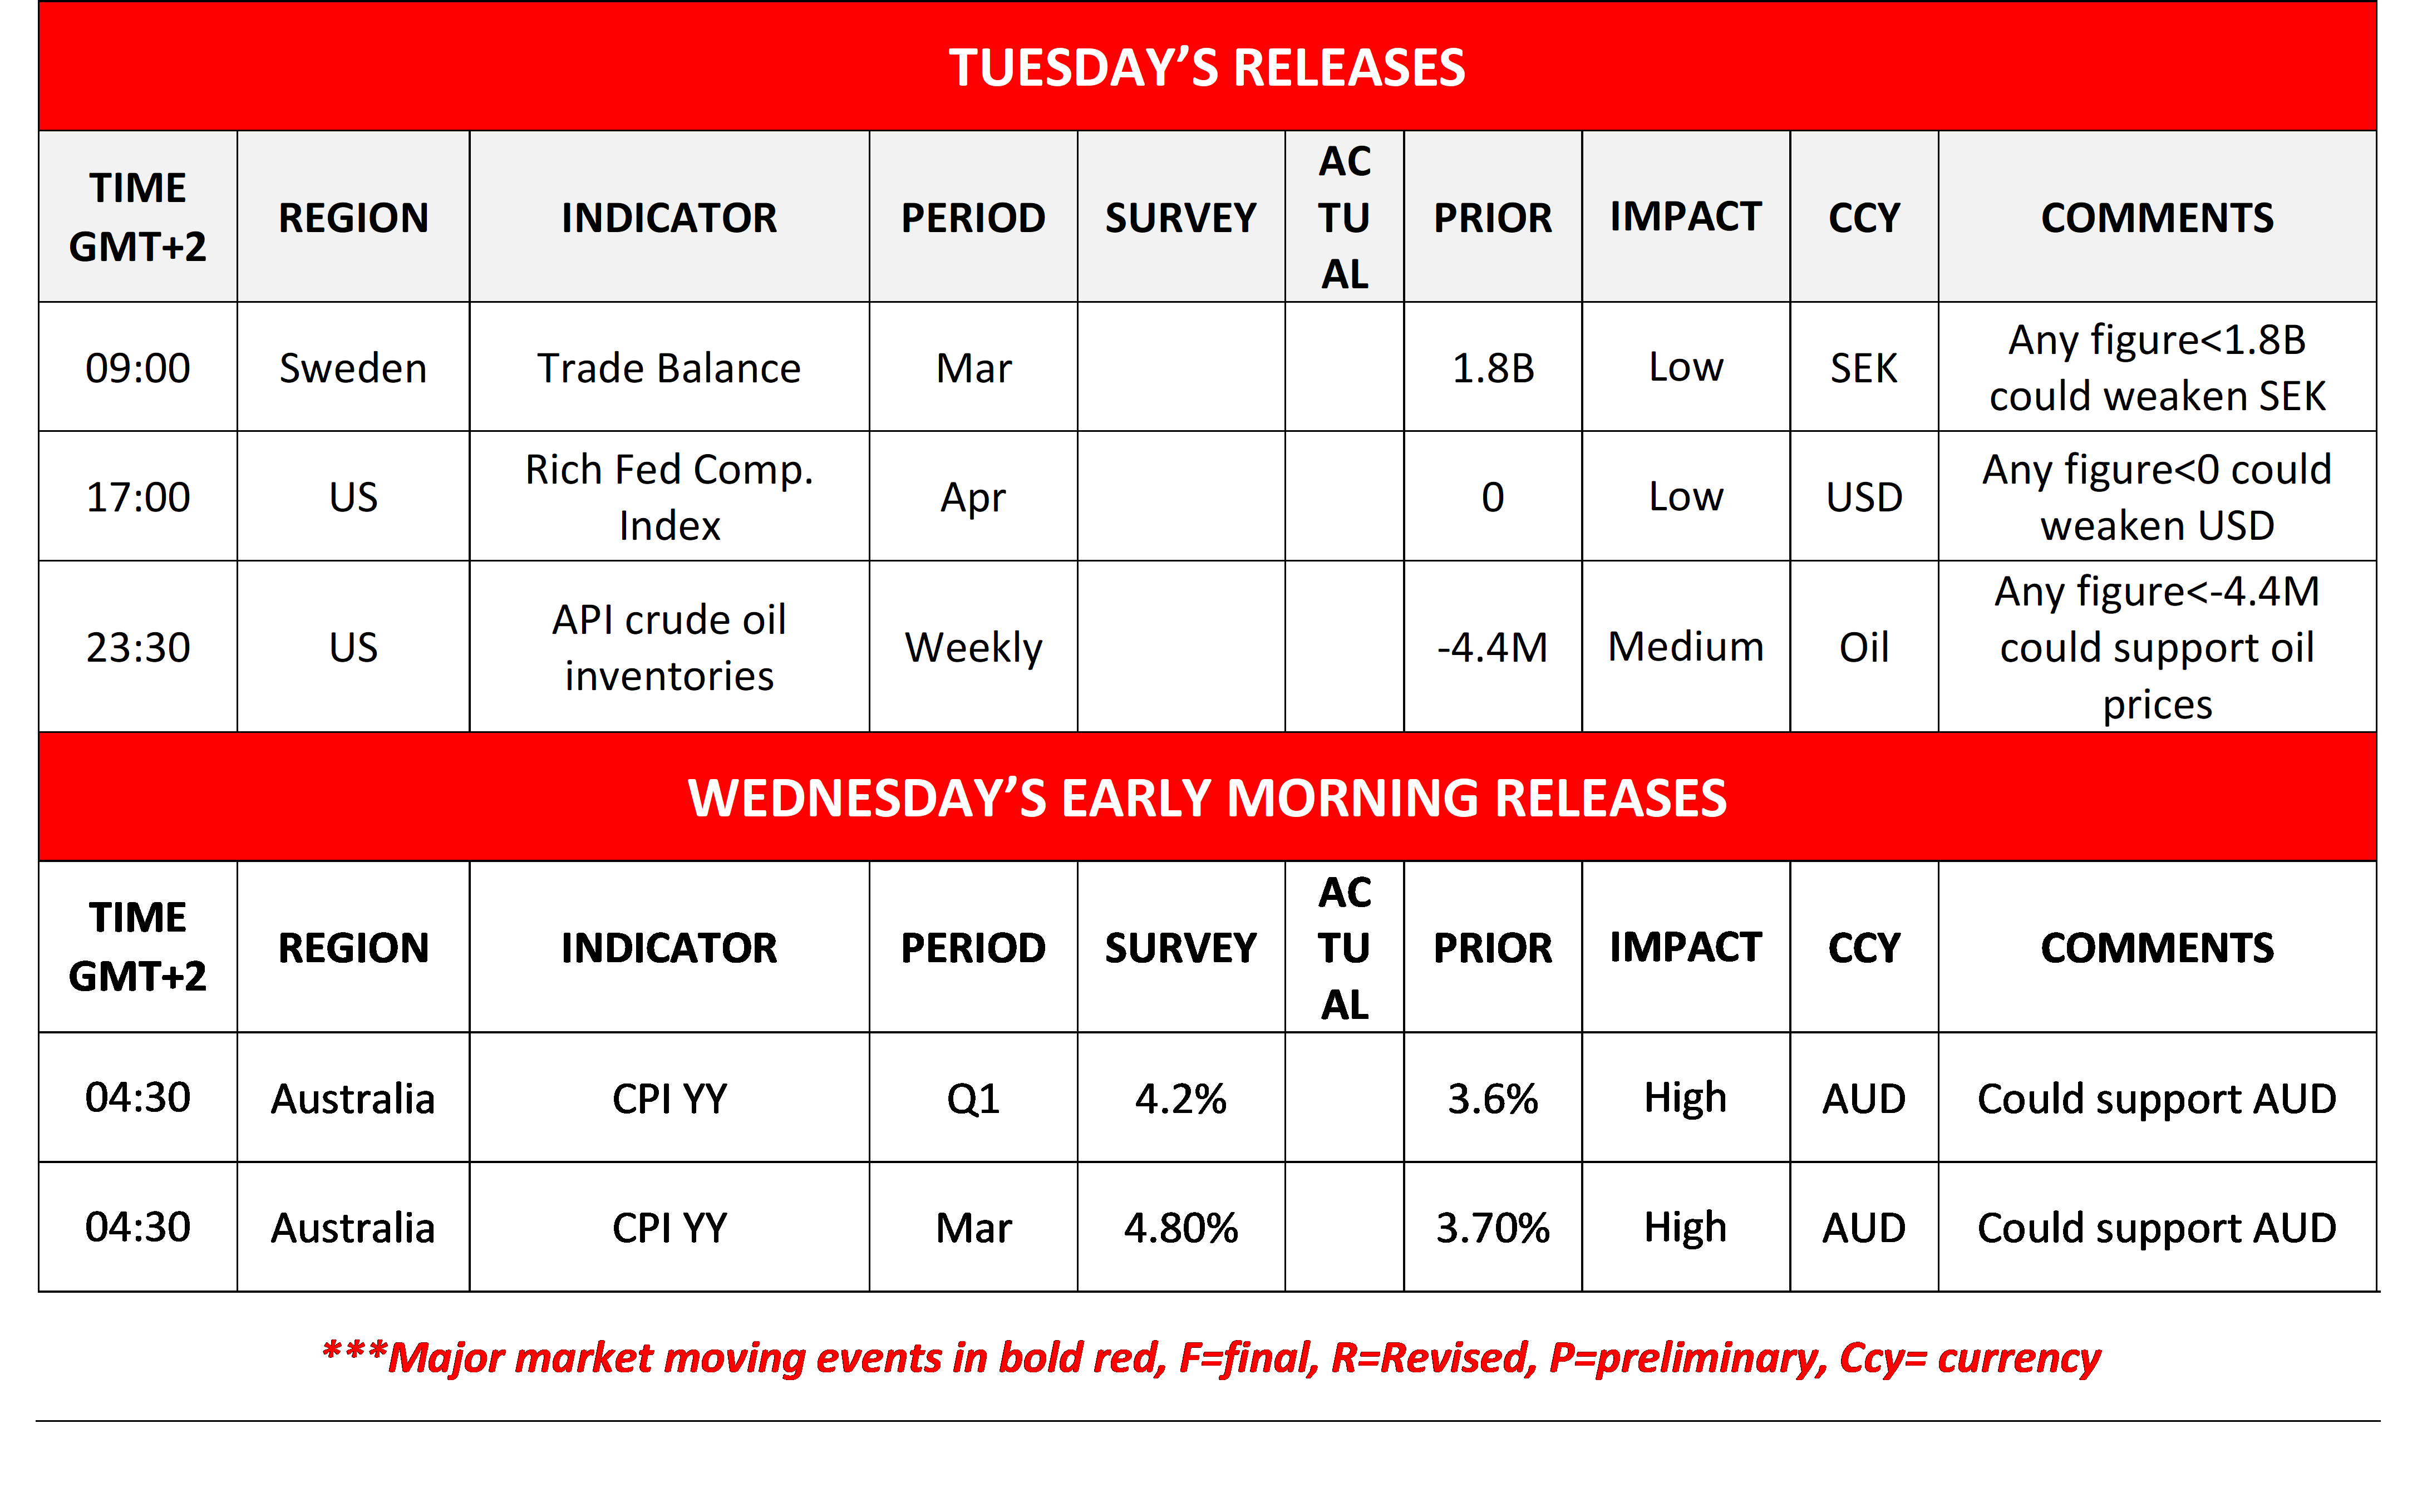
Australia’s March CPI rates in focus
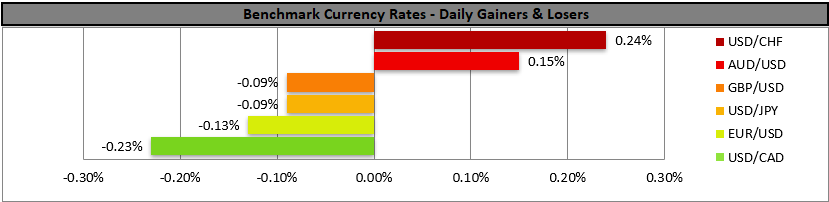
In the FX market the USD remained relatively stable against its counterparts. Given the low number of high-impact financial releases from the US we expect fundamentals to lead the markets. In tomorrow’s Asian session, we highlight the release of Australia’s CPI rates for March and Q1. The rates are allready above RBA’s targets and should they accelerate as expected or even more, we may see the Aussie getting some support as RBA may harden its hawkish stance.
US-Iranian impasse maintained
The impasse in the US-Iranian negotiations is maintained and no solution seems to be on the horizon. US President Trump seems to be unsatisfied by the Iranian plan which aimed to end the war. Should we see the market worries for the US-Iranian conflict be enhanced, we may see oil prices rising further. Also, we note the release of the US oil inventory data today and tomorrow and a possible wider drawdown could support oil prices as it would imply a further tightening of the US oil market.
US stock markets hesitate
US stock market indexes tended to stabilise yesterday with mixed signals emerging. Should we see the market’s confidence be boosted, we may see the market participants being more risk-oriented and thus providing support for US equities. Today’s headlines include the release of OpenAI by Microsoft, which enables the company to pursue deals with other Cloud data providers like Amazon. Also, Google is reported to have signed a classified AI deal with the Pentagon.
Gold continues to drift lower
Gold’s price continued to drift lower in today’s Asian session, as the USD tended to gain some ground. We currently see the case for the negative correlation of the two trading instruments being in effect. Gold traders maybe also positioning for a possibly hawkish Fed tomorrow, which also weighs on gold’s price.
Other highlights for today
In an easy going Tuesday, we note the release of Sweden’s March trade data, the US Richmond Fed Composite Index for April and the weekly API crude oil inventories figure.
Charts to keep an eye out
US 100
US 100 bulls seem to be hesitating as the index’s price action is nearing the 27500 (R1) resistance line. We maintain our bullish outlook for the index and intend to keep it as long as the upward trendline guiding it since the end of March remains intact.
Yet we note that the index’s movement in today’s Asian session is putting the upward trendline to the test. Please note that the RSI indicator, is above the reading of 70, which highlights the strong bullish market sentiment for the index, yet at the same time also suggests that the index’s price action is at overbought levels and the index is ripe for a correction lower.
Should the bulls maintain control over the index’s direction we may see reaching new All Time Highs, possibly breaking the 27500 (R1) resistance hurdle. Should the bears take over, we may see the index’s direction breaking the initially the prementioned upward trendline and continue lower to break also the 26250 (S1) support level.
XAU/USD
XAU/USD continued to edge lower in today’s Asian session, aiming for the 4550 (S1) support line.
The RSI indicator dropped below the reading of 50, implying the emergence of a bearish market sentiment for the precious metal’s price, yet the Bollinger bands continue to narrow.
For the adoption of a clearcut bearish outlook we would require gold’s price to break the 4550 (S1) support line and start aiming for the 4250 (S2) support level. For a bullish outlook, which seems remote currently, gold’s price has to reach if not breach the 4995 (R1) resistance level.
US 100 Cash Daily Chart
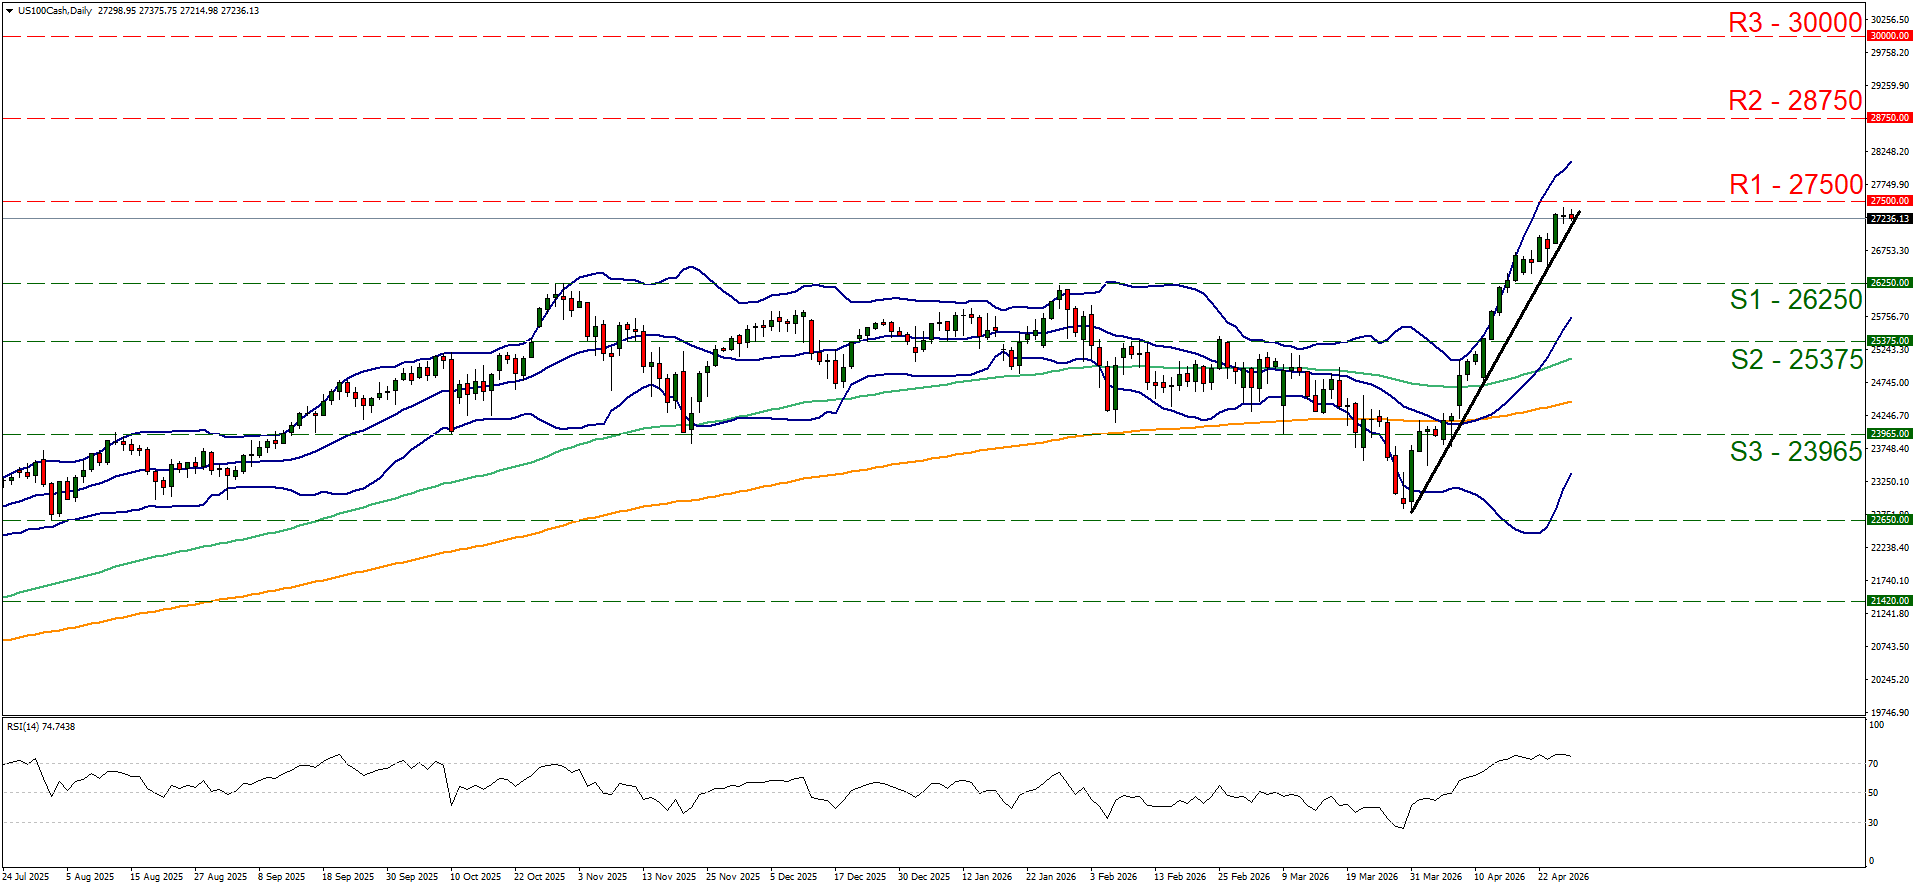
- Support: 26250 (S1), 25375 (S2), 23965 (S3)
- Resistance: 27500 (R1), 28750 (R2), 30000 (R3)
XAU/USD Daily Chart
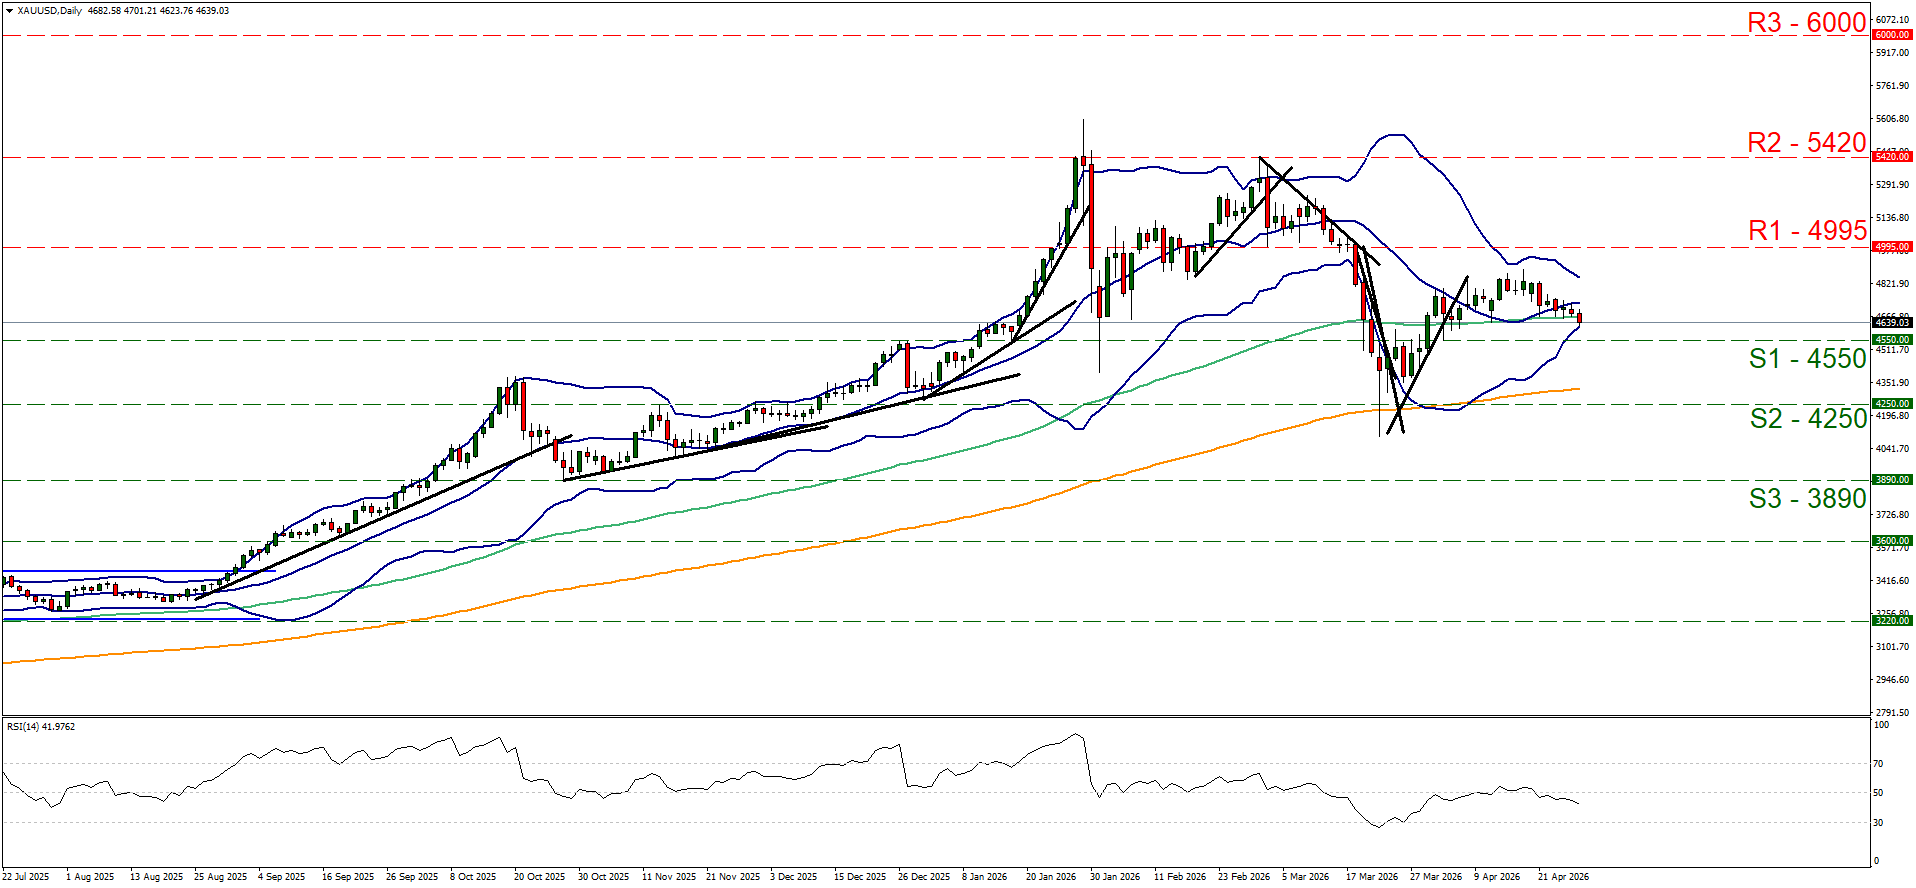
- Support: 4550 (S1), 4250 (S2), 3890 (S3)
- Resistance: 4995 (R1), 5420 (R2), 6000 (R3)
Isenção de responsabilidade:
Esta informação não é considerada como aconselhamento ou recomendação ao investimento, mas apenas como comunicação de marketing. O IronFX não é responsável por quaisquer dados ou pela informação fornecida por terceiros aqui mencionados, ou com links diretos, nesta comunicação.