
Market worries rekindled as the seizure of an Iranian tanker by the US raised fresh concerns about a potential escalation in the US-Iran conflict, despite earlier optimism surrounding a possible peace plan and Iran’s announcement regarding the reopening of the Straits of Hormuz.
The renewed uncertainty is already weighing on sentiment in the oil market, while also driving cautious moves across FX and equity markets as traders reassess the outlook for geopolitical stability.
Seizure of Iranian tanker worries the oil market
Despite high hopes for a possible peace plan in the US-Iranian conflict, after Iran announced the opening of the Straits of Hormuz, market worries re-emerged.
The seizure of an Iranian tanker from the US caused markets, particularly the international oil market to hesitate. Should we see the situation escalating further dimming market hopes for a possible peace deal, we may see oil prices gaining once again.
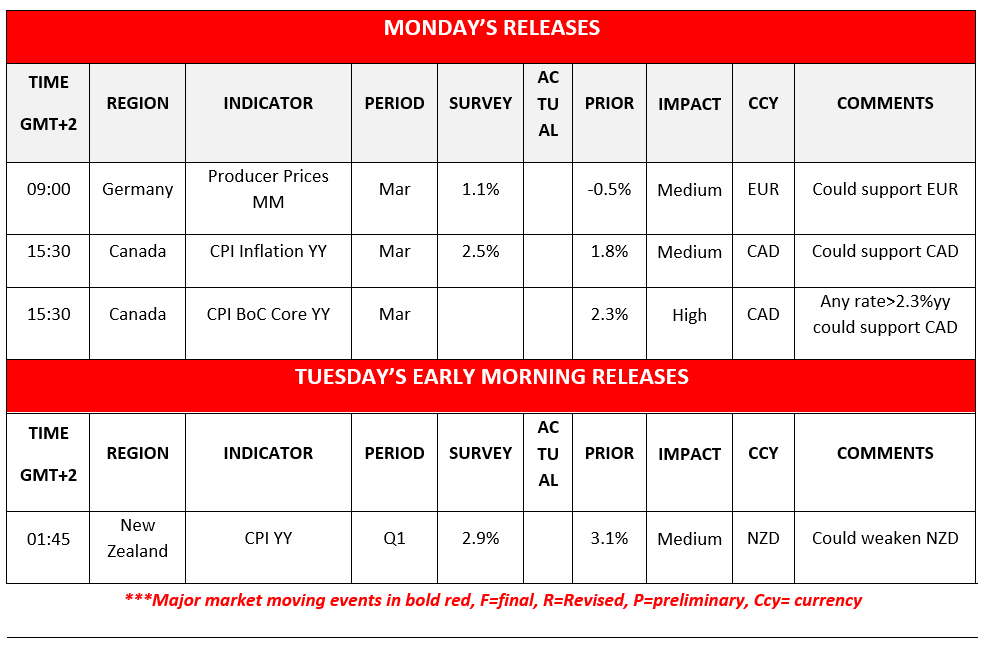
Canada’s March CPI rates to shake the Loonie
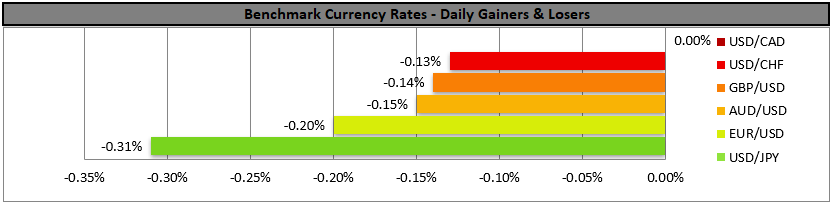
In the FX market the USD opened higher today as market worries tended to feed the greenback with safe haven inflows. Today’s higher opening seems like an overreaction for the time being as the USD is correcting lower currently.
North of the US border Loonie traders are focusing on the release of Canada’s CPI rates for March and a possible acceleration could support the CAD as it could enhance BoC’s hawkishness somewhat.
Across the Atlantic UK PM Starmer seems to be fighting for his political survival and should political uncertainty emerge in the UK we may see the pound losing some ground.
US stock markets prepare to end the week at record high levels
US stock markets despite opening lower as the week begins seem to remain confident as major US stock market indexes remain near record high levels.
The US-Iran conflict is expected to remain a major market influencer for US equities as well. Yet investors are expected also to focus on the current week’s earnings reports, as they are expected to create substantial headlines. Today we get the earnings report of Rio Tinto, tomorrow of 3M, Tesla, IBM, Boeing and AT&T on Wednesday, Intel’s on Thursday and P&G’s on Friday.
Other highlights for today
Today we get Germany’s PPI rates for March and tomorrow we highlight the release of New Zealand’s CPI rates for Q1 26.
As for the rest of the week
Tomorrow, Tuesday we get UK’s employment data for February and the US retail sales for March. On Wednesday, we get the UK CPI Rates for March, while in Turkey CBT is to release its interest rate decision. On Thursday we get April’s preliminary PMI figures for the EuroZone, the UK and the US and on Friday we highlight Japan’s CPI rates for March.
Charts to keep an eye out
WTI
WTI’s tumbled on Friday yet regained most of the losses and in today’s Asian session, despite some bearish tendencies seemed to remain between the 93.80 (R1) resistance line and the 87.10 (S1) support level. We tend to maintain a bearish outlook for the commodity’s price yet note that the bearish sentiment seems to have eased a bit which may allow for sideways motion to prevail. Should the bears maintain control over WTI’s price, we may see it breaking the 87.10 (S1) support line this time clearly and start aiming for the 82.00 (S2) support base once again. Should the bulls take over, we may see WTI’s price breaking the 93.80 (R1) resistance line and start aiming for the 100.90 (R2) resistance barrier.
USD/CAD
USD/CAD edged higher in today’s Asian session nearing the 1.3720 (R1) resistance line. We maintain a bearish outlook for USD/CAD, given that the downward trendline guiding it remains intact. Also the RSI indicator despite edging higher remains well below the reading of 50, implying a bearish market sentiment for the pair. We set as the next possible target for the bears the 1.3550 (S1) support line. For a bullish outlook, which may be remote but still possible, we would require USD/CAD to break initially the prementioned downward trendline, signalling an interruption of the downward movement, continue to break the 1.3720 (R1) resistance line and start actively aiming for the 1.3880 (R2) resistance hurdle.
WTI Daily Chart
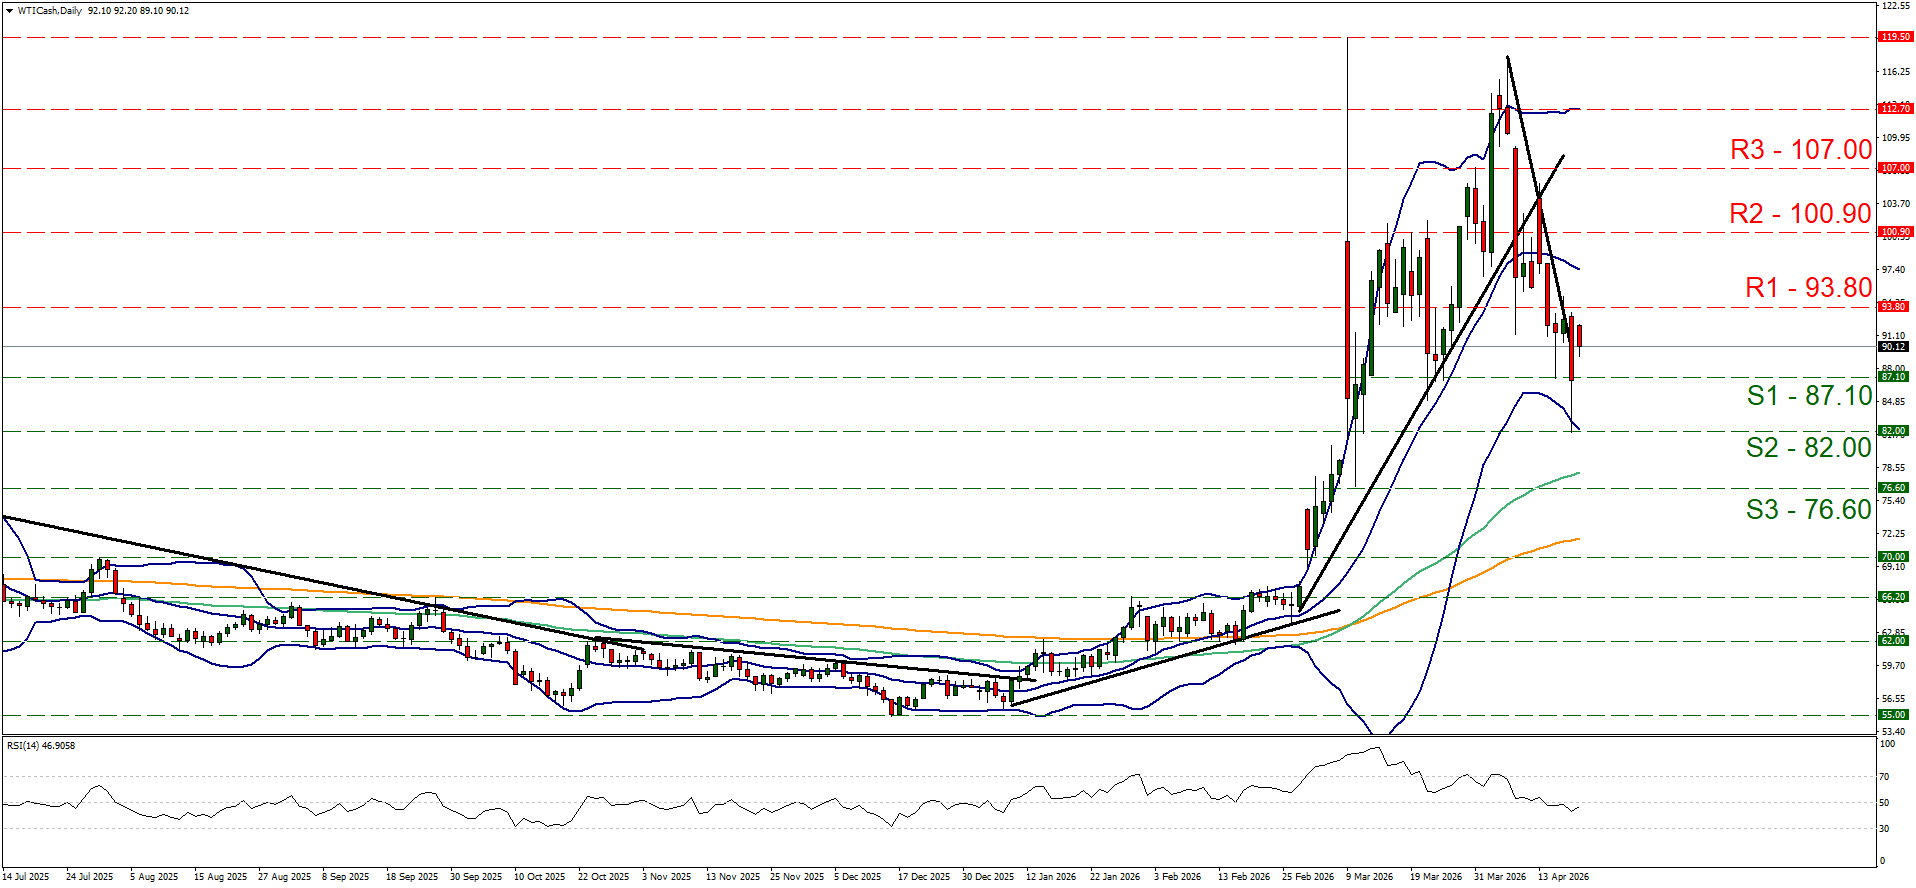
- Support: 87.10 (S1), 82.00 (S2), 76.60 (S3)
- Resistance: 93.80 (R1), 100.90 (R2), 107.00 (R3)
USD/CAD Daily Chart
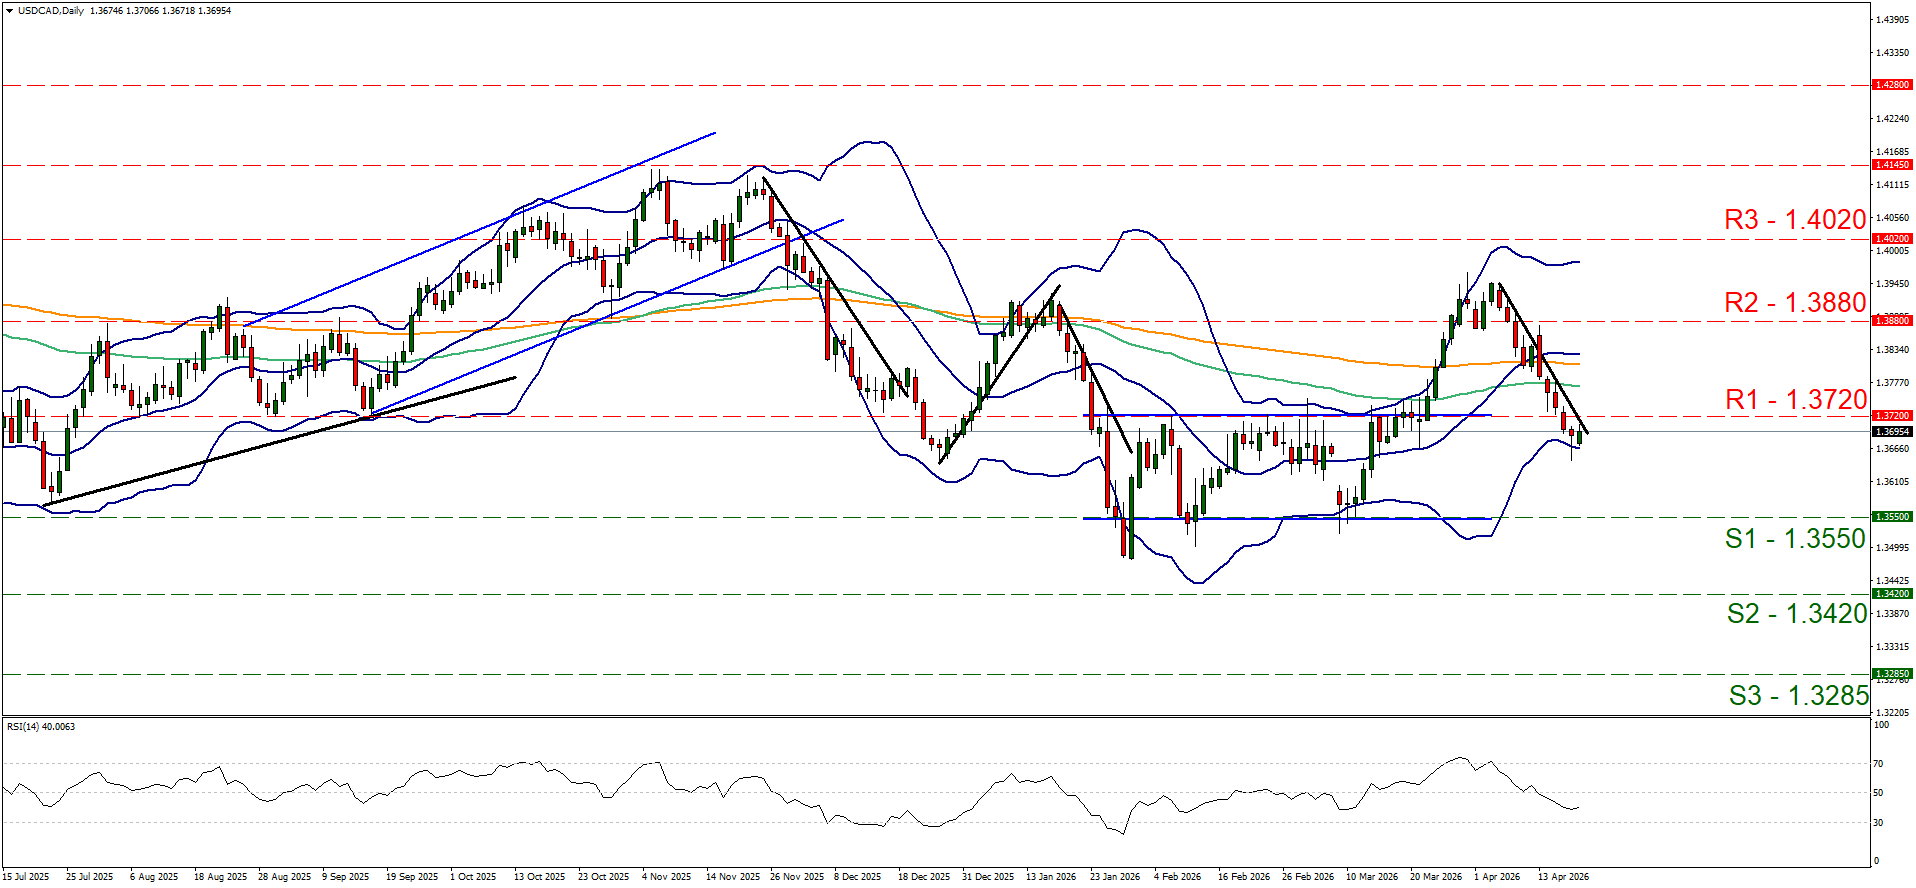
- Support: 1.3550 (S1), 1.3420 (S2), 1.3285 (S3)
- Resistance: 1.3720 (R1), 1.3880 (R2), 1.4020 (R3)
Disclaimer:
This information is not considered as investment advice or an investment recommendation, but instead a marketing communication. IronFX is not responsible for any data or information provided by third parties referenced, or hyperlinked, in this communication.