 NL
NL  EN
EN  FR
FR  ES
ES  JA
JA  KO
KO  PT
PT  ZH
ZH  AR
AR  FA
FA  RU
RU  MS
MS  VI
VI  PH
PH  TH
TH  ID
ID 

Since our last report Gold’s price, appears to be moving in a downwards trajectory. In today’s report we are to discuss mainly fundamental issues and we intend to end the report with a technical analysis of Gold’s daily chart.
US Employment data to be released on Friday
The US Employment data for September is due out on Friday. According to expectations by economists, the NFP is set to decrease from 162k to 98k, which would imply a loosening labour market in spite of the unemployment rate remaining 4.1%. Thus, a loosening labour market could increase pressure on the FED to withhold from aggressively raising interest rates in the near future. In turn, this could increase downwards pressures on the dollar whilst aiding gold’s price considering the two assets’ inverse relationship. However, we should note that the NFP figure is notoriously volatile and tends to exceed or underperform the expectations made by economists, hence the release could easily upend or confirm our bias.
Trump rejects Iran’s peace proposal
Trump has rejected Iran’s peace proposal over the weekend. As a reminder, Tehran had offered Washington a new seven-day proposal to re-open the Strait of Hormuz and to restart broader talks in order to bring an end to the war. Iranian Foreign Minister Abbas Araghchi had stated that “We have introduced a plan to the United States through the mediators that if certain conditions are met . . . the strait will be open in seven days”. However, on Saturday President Trump stated that “They want to make a deal to open the Hormuz Strait immediately because they’re losing so badly” and that the US was “we’re winning tremendously”. In turn, the rejection of Iran’s proposal may lead to elevated geopolitical tensions in the Middle East, which could aid gold’s price considering its status as a safe haven asset.
US Inflation data
The US inflation data for August is set to be released this Wednesday. In particular, the inflation data is set to be released this Wednesday, with economists currently anticipating the rate to come in at 3.4%, which would be higher than the prior 3.3%, implying an acceleration of inflationary pressures in the US economy. In turn, should the PCE rates, which are the Fed’s favourite tool for measuring inflation in the US economy, come in higher than expected, then it may increase pressure on the Fed to maintain its restrictive monetary policy stance, which could provide support for the dollar whilst weighing on gold’s price given their inverse relationship with one another.
TECHNISCHE ANALYSE
XAU/USD Daily Chart
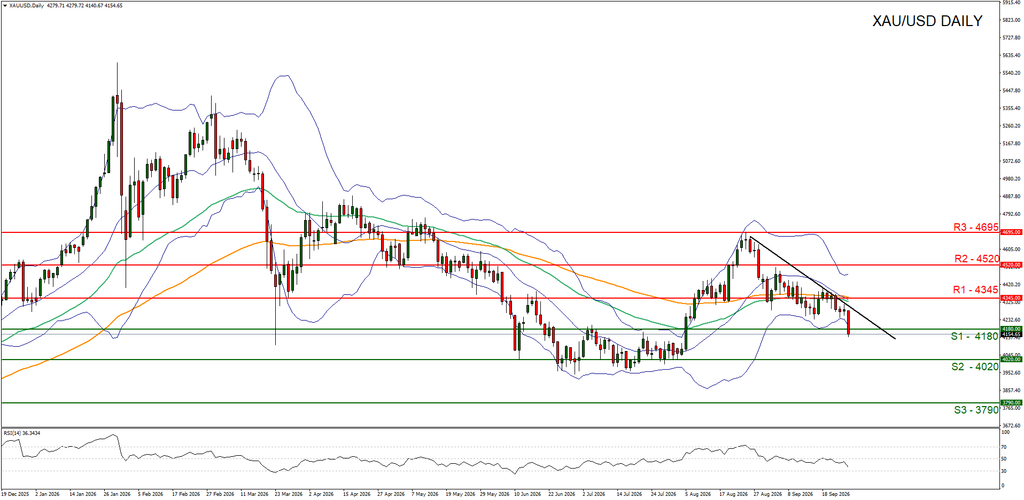
Resistance: 4345 (R1), 4520 (R2), 4695 (R3)
Gold’s price appears to be moving in a downwards fashion after clearing our support turned to resistance at our 4345 (R1) level. We opt for a bearish outlook for the precious metal’s price and supporting our case is the RSI indicator below our chart, which currently registers a figure below 40, implying a strong bearish market sentiment. For our bearish outlook to continue we would require gold’s price to close below our 4180 (S1) support level, with the next possible target for the bears being our 4020 (S2) support base. On the other hand, for a sideways we would require gold’s price to remain confined between our 4180 (S1) support level and our 4345 (R1) resistance line. Lastly, for a bullish outlook we would require a clear break above our 4345 (R1) resistance level, with the next possible target for the bulls being our 4520 (R2) resistance line.
Disclaimer:
This information is not considered as investment advice or an investment recommendation, but instead a marketing communication.


