
Euro Zone’s inflationary pressures
In the FX market we note the strengthening of the USD, while JPY continues to weaken against the greenback. We turn our attention towards the Euro Zone’s preliminary HICP rate for June and a possible wider than expected easing of inflationary pressures may weigh on the common currency.
In the American session, we notice the release of the US employment data for June, given also the release of the US employment report for the same month tomorrow. Furthermore, the release of the US ISM manufacturing PMI figure for is expected to be closely watched as well in signs of progression of economic activity.
Oil prices hesitate to drop further
Oil prices seem to hesitate to drop materially further, presenting a picture of stabilisation. We still consider the developments in the Middle East as the key issue for oil prices on a fundamental level, and any enhancement of the oil market’s hopes for a normalization of the situation in the area may exercise downward pressure on oil prices.
US stock markets end quarter in the positives
S&P 500, Nasdaq and Dow Jones ended the quarter in the greens after a stellar April and May and with some hesitation in June. The Fed’s intentions are still considered key for US equities and today market attention may be on Fed Chairman Warsh’s speech. A continuance of the hawkish tone could weigh on US equities, while a possible easing may allow for further advances higher.
Gold’s price edges lower
Gold’s price was in the reds since the start of the week and the strengthening of the USD in today’s Asian session renewed gold’s bearish tendencies. Gold’s bearish motion over the quarter was impressive with the precious metal losing almost 30% of its value since January. Also the higher US treasury yields add more bearish pressures on the non interest bearing precious metal. Should we see the USD strengthening further we may see gold’s price suffering more losses and vice versa.
금일 주요 경제 뉴스
Today we get UK’s Nationwide House prices, Germany’s final manufacturing PMI figure, both for June and the US weekly crude oil inventories figure. Meanwhile ECB’s Forum at Sintra is starting and Fed Chair Warsh, ECB President Lagarde, BoE Governor Bailey and BoC Governor Macklem are scheduled to speak. In tomorrow’s Asian session we get Australia’s trade data for May.
Charts to keep an eye out
EUR/USD hit a ceiling at the 1.1435 (R1) resistance line yesterday. Given that the pair’s price action was unable to break the R1 we tend to maintain our bias for a sideways motion of the pair between the R1 and the S1. Yet the low position of the RSI indicator implies a bearish predisposition of the market for the pair that could drag its price action lower. Should the bears take over, we may see EUR/USD breaking the 1.1325 (S1) support line and start aiming for the 1.1210 (S2) support level. Should the bulls be in the driver’s seat, we may see the pair breaking the 1.1435 (R1) resistance level and start aiming for the 1.1575 (R2) base.
골드’s price remained just above the 3960 (S1) support line as if it has hit the floor. The downward direction of the precious metal’s price action over the past ten days and the bearish sentiment implied by the RSI indicator suggest a bearish outlook, yet the inability of gold’s price to form a new lower trough, suggests stabilisation. For the bearish outlook to be maintained we would require gold’s price to break the 3960 (S1) support line and start aiming for the 3600 (S2) support level. Should the bulls take over we may see gold’s price nearing if not breaching the 4380 (R1) resistance line.
EUR/USD Daily Chart
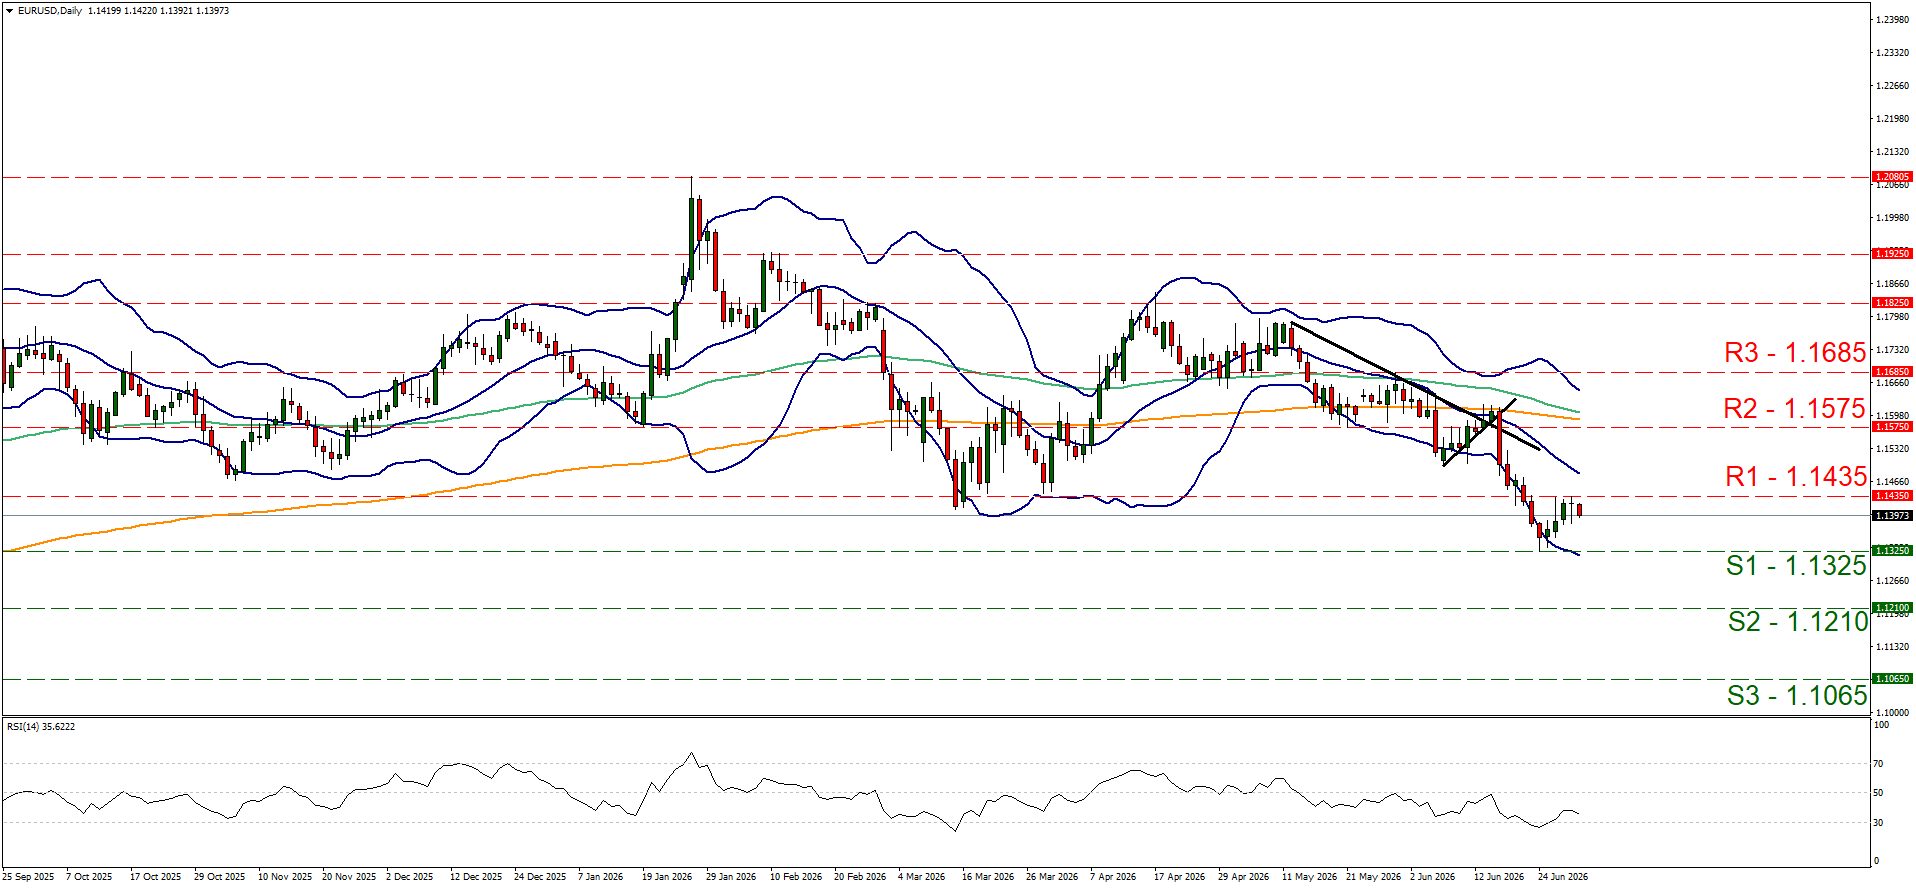
- Support: 1.1325 (S1), 1.1210 (S2), 1.1065 (S3)
- Resistance: 1.1435 (R1), 1.1575 (R2), 1.1680 (R3)
XAU/USD Daily Chart
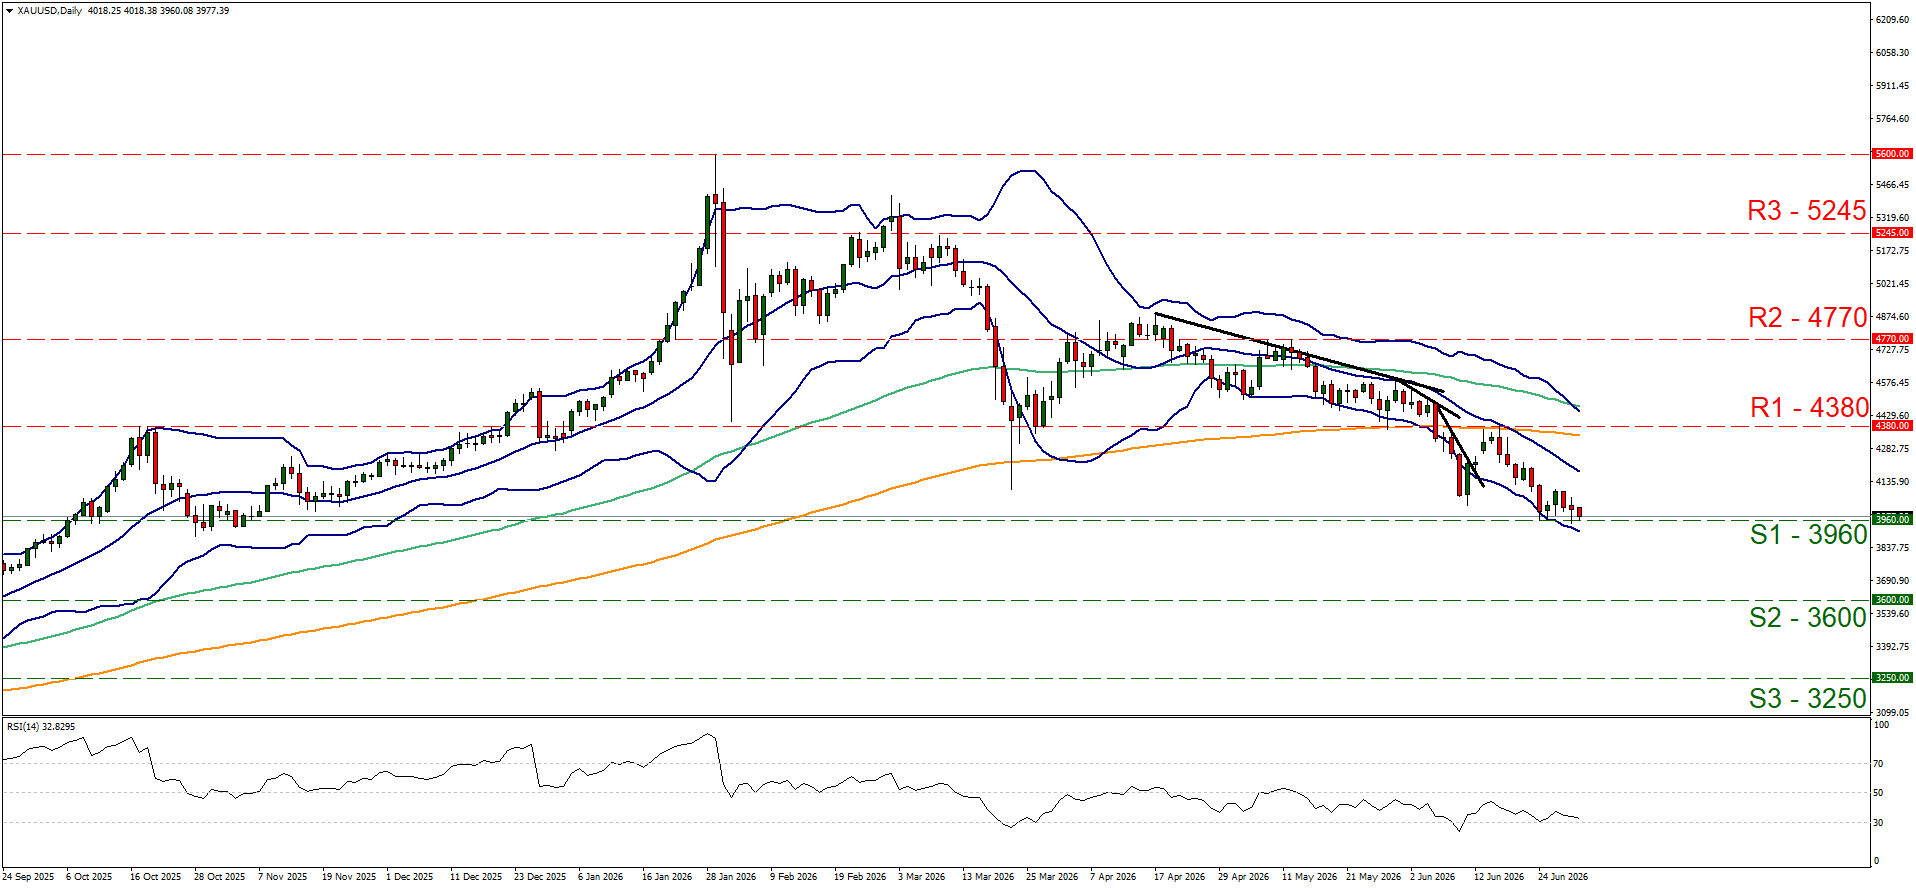
- Support: 3960 (S1), 3600 (S2), 3250 (S3)
- Resistance: 4380 (R1), 4770 (R2), 5245 (R3)
면책 조항:
본 자료는 투자 권유가 아니며 정보 전달의 목적이므로 참조만 하시기 바랍니다. IronFX는 본 자료 내에서 제 3자가 이용하거나 링크를 연결한 데이터 또는 정보에 대해 책임이 없습니다.