
Uncertainty in the markets remains as investors weigh easing geopolitical tensions against persistent supply-side risks.
Oil prices have stabilised for now, supported by tighter physical market conditions caused by the US blockade of Iranian ports, while hopes for a diplomatic breakthrough continue to limit upside volatility.
At the same time, US equities remain near record highs and the USD shows signs of hesitation, reflecting a cautious but still optimistic market mood.
Oil prices stabilise for now
Oil prices tended to stabilise in yesterday’s American today’s Asian session. On a fundamental level, the notion of a diplomatic solution to the US-Iran war seems to be gaining further ground, yet there is still considerable hesitation on whether such a scenario will play out.
It should be noted that the US blockade of Iranian ports tends to tighten the physical oil market. Should we see market worries for the US-Iran war easing further we may see oil prices losing more ground.
US equities remain high
US equity indexes continued to rise, with S&P 500 and Nasdaq reaching new All Time High levels, implying a substantial optimism on behalf of the markets.
Also, major US banks tended to release better EPS and revenue figures than expected, also contributing to the market’s optimism. In today’s aftermarket hours, we highlight the release of Netflix’s earnings report.
Market focus is expected to be placed on the company’s forward guidance about its yearly sales figure and the EPS and revenue figures. We are also interested in the company’s capital allocation plans, given that the Warner Bros merger is off.
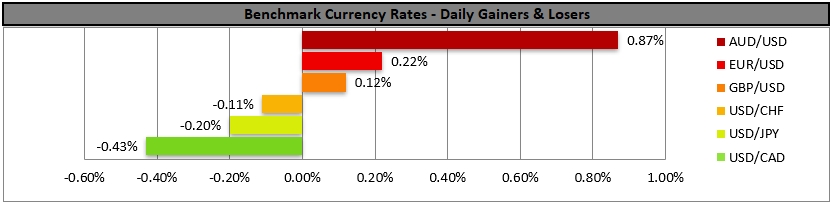
USD bears seem to hesitate
In the FX market USD bears seem to hesitate to drive the greenback lower. We tend to maintain a bearish outlook for the USD, should market optimism continue to grow, given the USD’s safe-haven status.
Australia’s employment data for March sent mixed signals, yet China’s GDP rate for Q126 implied a faster than expected growth, providing some optimism for the markets.
本日のその他の注目点
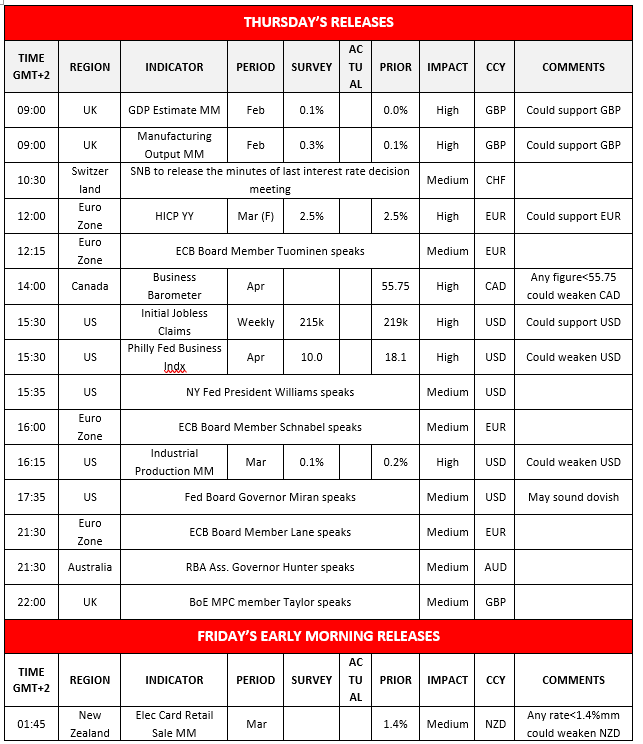
Today we get UK’s GDP and manufacturing output rates for February, Euro Zone’s final HICP rates for March, Canada’s business barometer for April, and from the US we note the release of the weekly initial jobless claims figure, April’s Philly Fed Business index and industrial production rate for March.
On a monetary level, we note that Switzerland’s SNB is to release the minutes of last interest rate decision meeting, while ECB’s Tuominen, Schnabel and Lane, the Fed’s William’s and Miran, RBA’s Hunter and BoE’s Taylor are scheduled to speak. In tomorrow’s Asian session, we get New Zealand’s Electronic retail sales for March.
Charts to keep an eye out
WTI’s
WTI’s price tended to stabilise in yesterday’s American and todays’ Asian sessions between the 93.80 (R1) resistance line and the 87.10 (S1) support level.
The RSI indicator seems stuck at the reading of 50, implying a rather indecisive market, yet the downward trendline guiding WTI’s price action since the 7 of April remains intact suggesting a continuance of WTIs’ downward motion.
Should the bears maintain control over WTIs’ price action, we may see it breaking the 87.10 (S1) support line and start aiming for the 82.00 (S2) support level. Should the bulls take over, we may see WTI’s price breaking the 93.80 (R1) resistance line and start aiming for the 100.90 (R2) resistance level.
S&P 500
S&P 500 continued to rise yesterday and in today’s Asian session was able to reach new All Time High levels by breaking the 7015 (S1) resistance line, now turned to support.
We maintain a bullish outlook for the index’s direction as long as the upward trendline guiding it since the 31 of March remains intact.
Yet we also note that the RSI indicator has reached the reading of 70 and the index’s price action is constantly flirting with the upper Bollinger band, which may imply that WTI’s price action has reached overbought levels and may be ripe for a correction lower.
We set as the next possible target for the bulls the 7250 (R1) resistance line, yet note that the index is in unchartered waters. Should the bears take over ,we may see the index breaking the 7015 (S1) support line and continue to break also the 6715 (S2) support level.
WTI Daily Chart
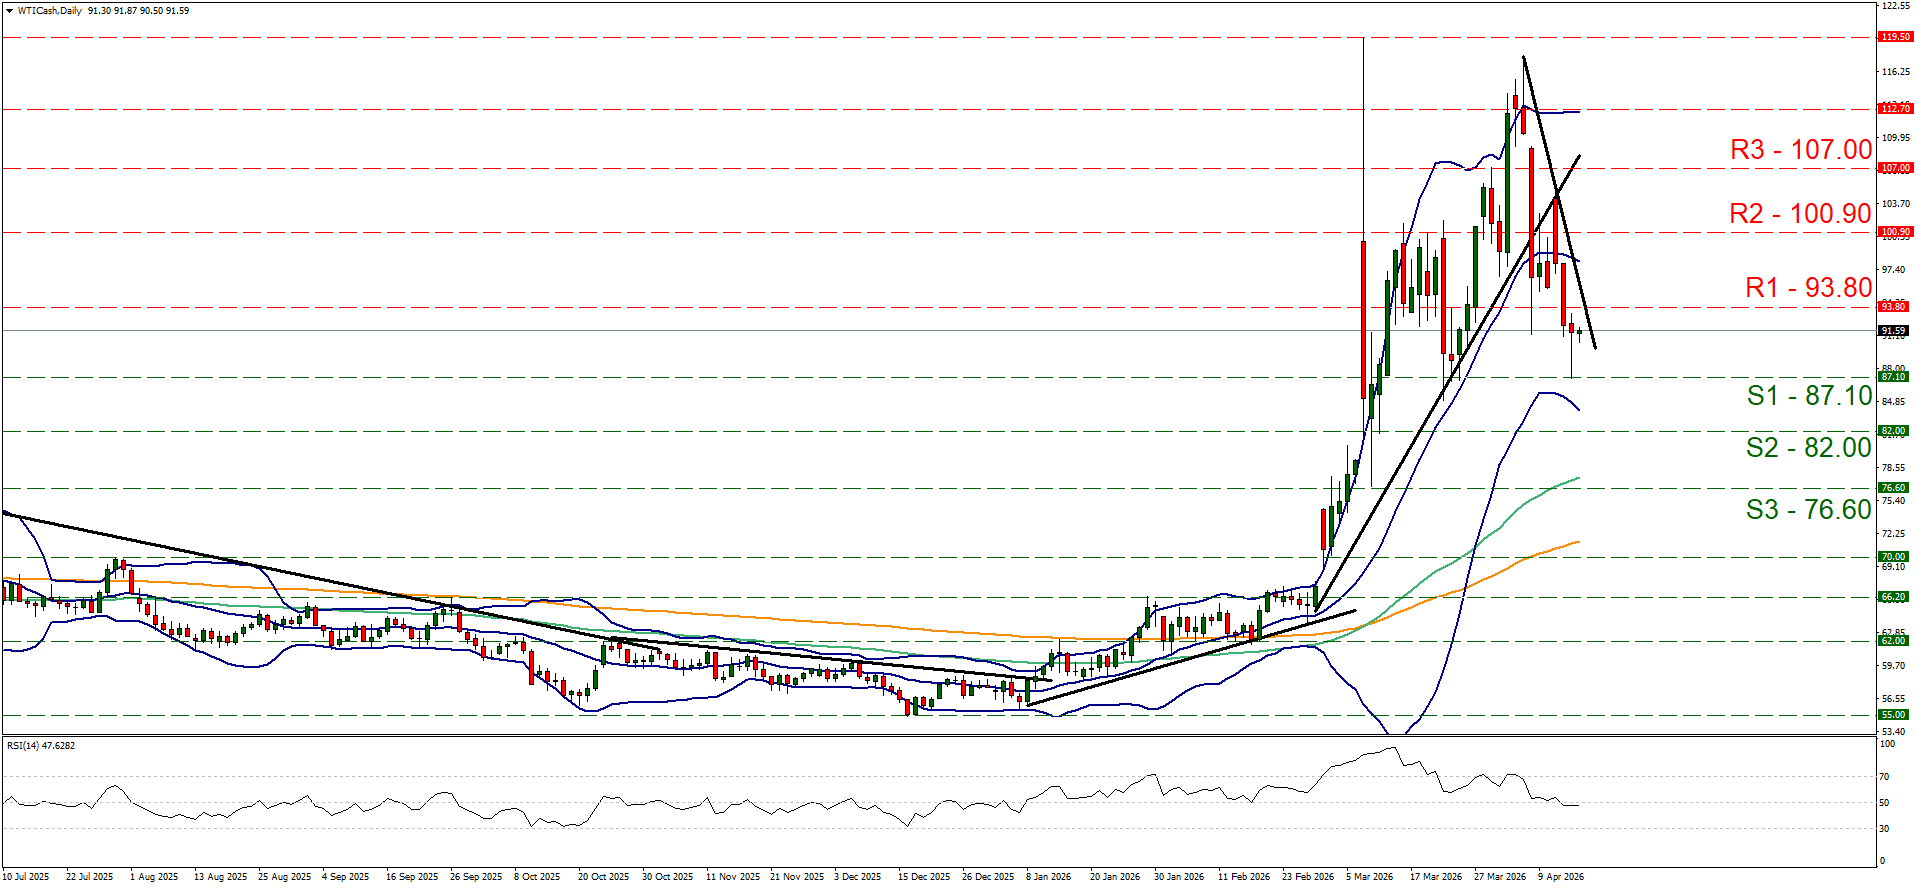
- Support: 87.10 (S1), 82.00 (S2), 76.60 (S3)
- Resistance: 93.80 (R1), 100.90 (R2), 107.00 (R3)
US 500 Cash Daily Chart
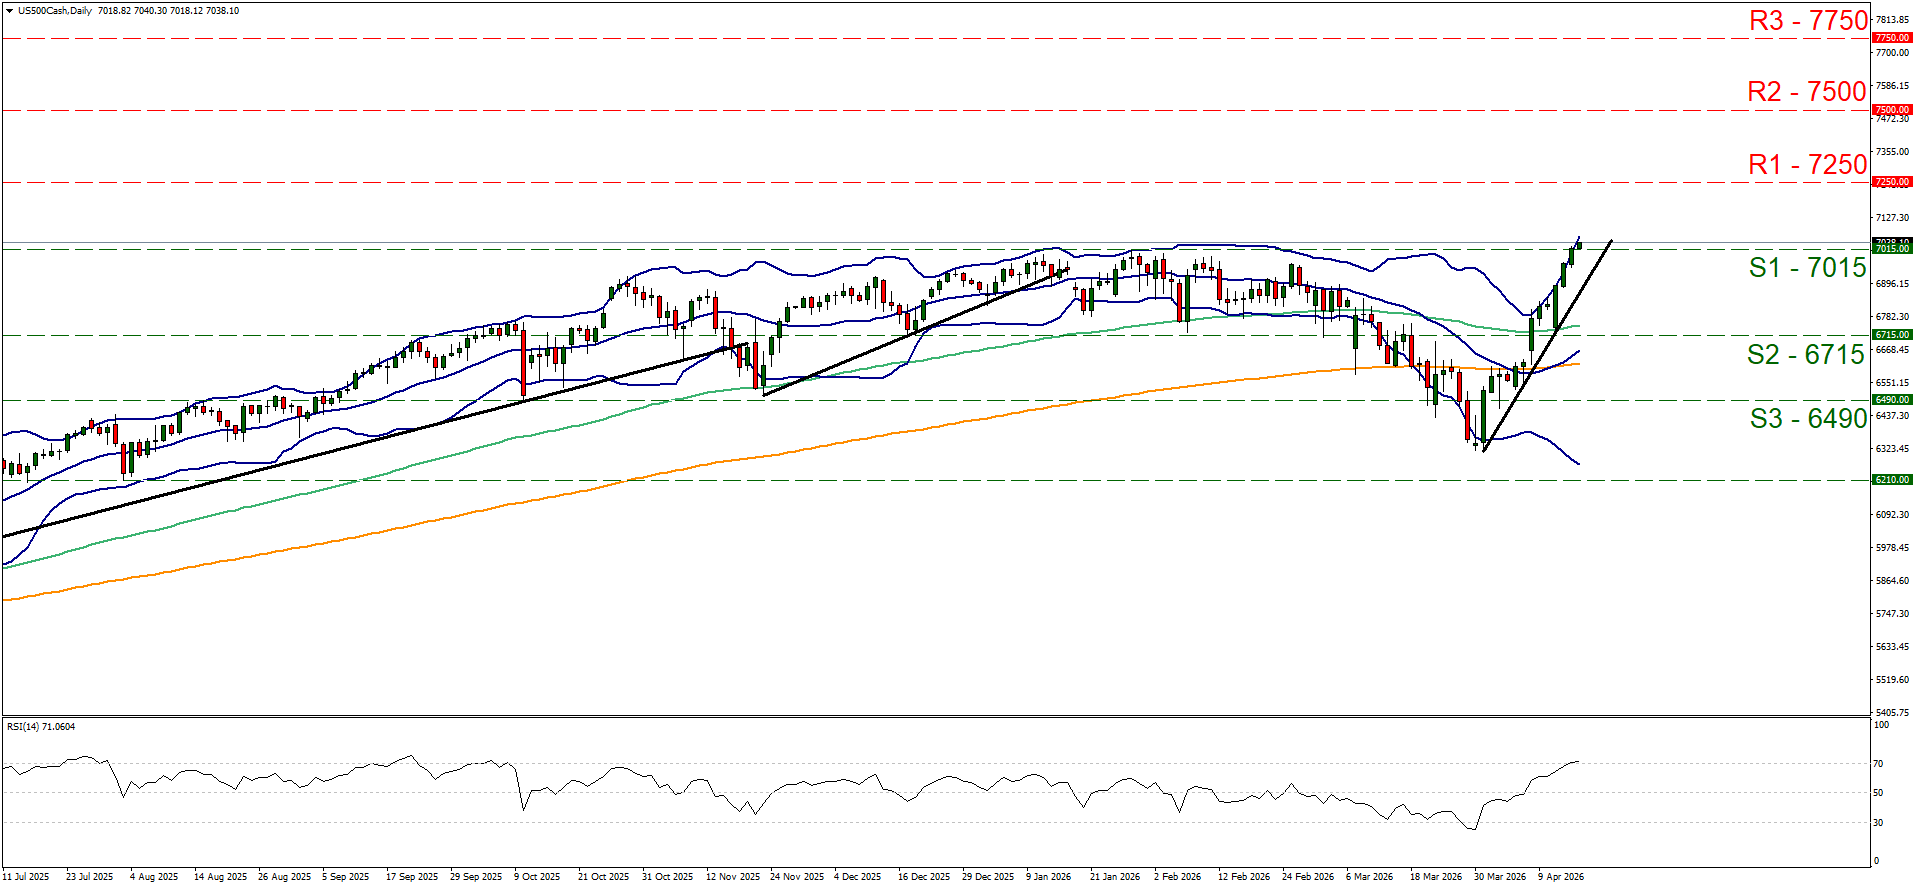
- Support: 7015 (S1), 6715 (S2), 6490 (S3)
- Resistance: 7250 (R1), 7500 (R2), 7750 (R3)
免責事項:
本情報は、投資助言や投資推奨ではなく、マーケティングの一環として提供されています。IronFXは、ここで参照またはリンクされている第三者によって提供されたいかなるデータまたは情報に対しても責任を負いません。