 JA
JA  EN
EN  FR
FR  ES
ES  KO
KO  PT
PT  ZH
ZH  AR
AR  FA
FA  RU
RU  NL
NL  MS
MS  VI
VI  PH
PH  TH
TH  ID
ID 

June’s US CPI rates
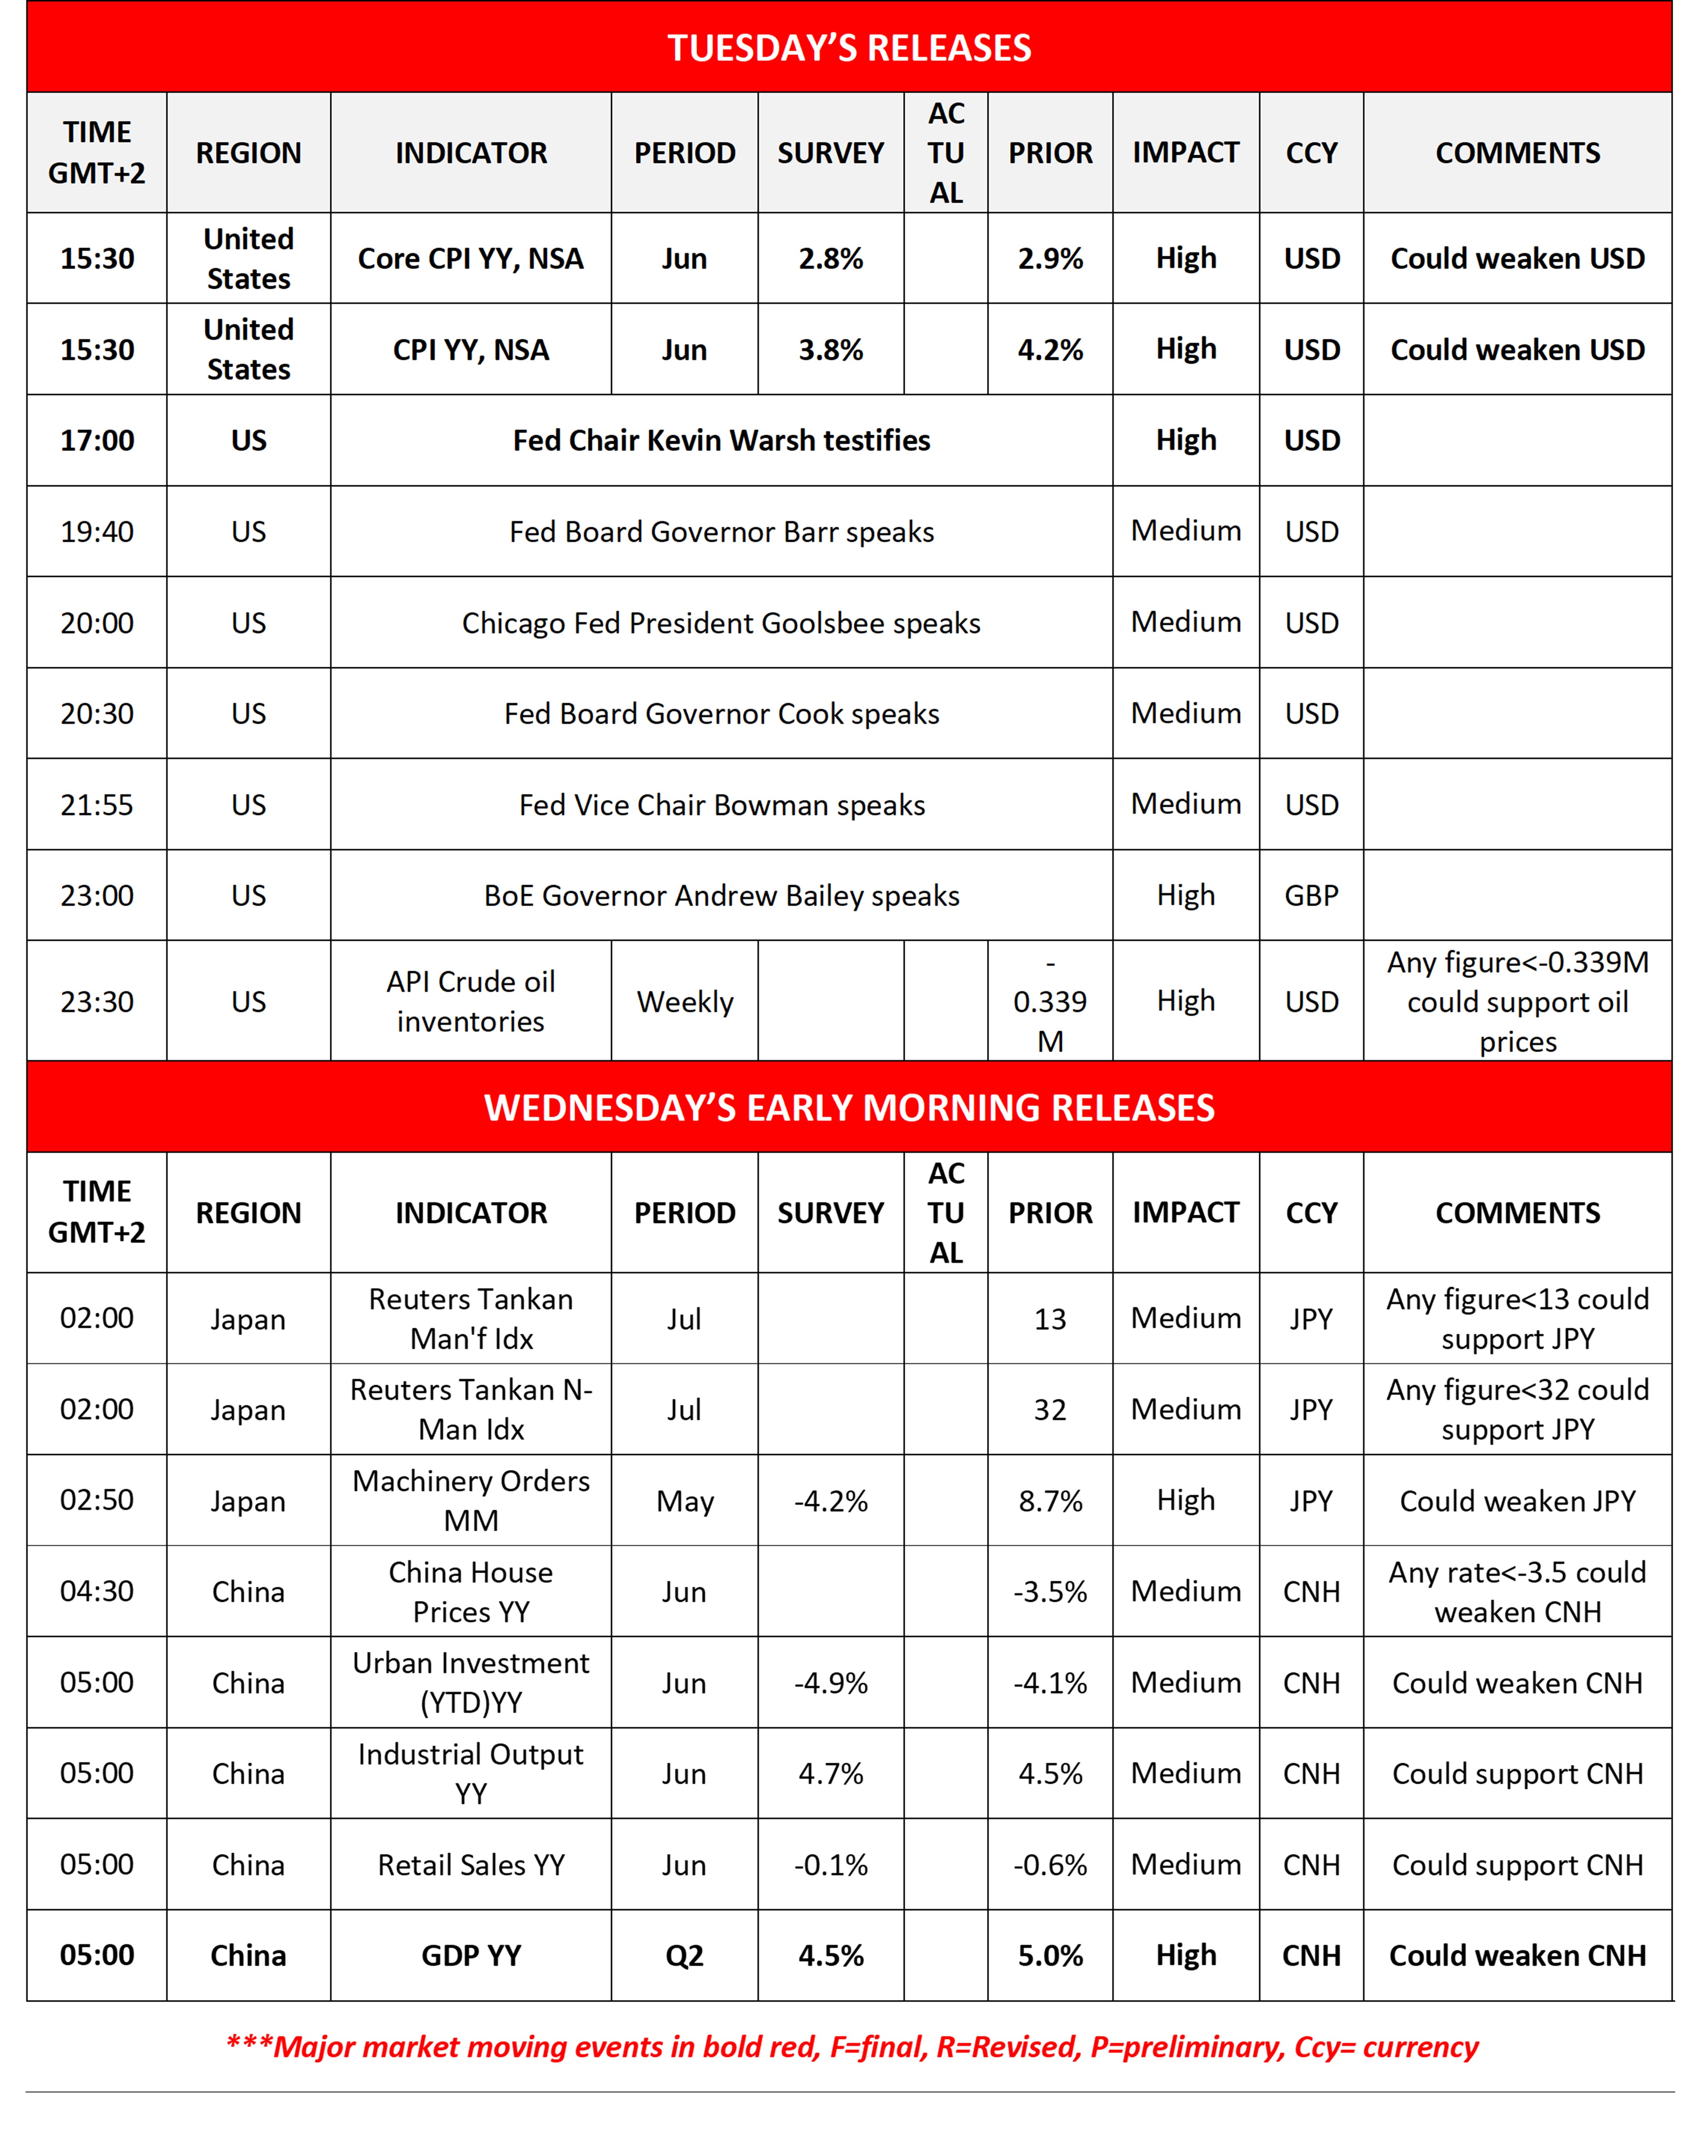
Market focus is expected to be placed on the release of the US CPI rates for June. The rates are expected to slow down implying an easing of inflationary pressures in the US economy. Should the rates slow down more than expected we may see the USD losing ground as market’s hawkish expectations for the Fed’s intentions may start easing. Should the rates fail to slow down, or even accelerate, the release could take the markets by surprise, forcing them to reposition themselves, by supporting the USD and selling gold and US equities.
Fed Chair Warsh’s testimony
In today’s American session, Fed Chair Warsh is expected to testify before the US Senate. It’s to be the first testimony by Warsh and he is expected to be grilled by Senators, especially Democrats. Should we see Warsh sending out hawkish signals we may see gold’s price losing ground while at the same time, we may see the USD gaining some ground and US equities falling in the reds. Should the Fed Chair opt to adopt a more dovish approach, we may see gold’s price and US equities gaining and the USD weakening.
Kick-off of the earnings season
The earnings season kicks off with JP Morgan, Bank of America, Goldman Sachs, Wells Fargo and Citigroup releasing their reports. Despite the main market issue being the AI sector, the financial health of major US banks is also expected to captivate the market’s attention and better than expected revenue and EPS figures could improve market sentiment lifting US equities prices.
Oil prices rally as US-Iran conflict flares up
Oil prices rallied yesterday, as the US-Iran conflict flares up. On the one hand the Iranians have proceeded with missile attacks on oil tankers at the Straits of Hormuz while the US military carried strikes against Iran for a third consecutive night. Should we see market worries for the flow of oil through the Persian Gulf intensifying we may see oil prices getting more support. On the other hand, the market may have not totally given up on diplomacy and a possible easing of the oil market’s worries could weigh on oil prices.
本日のその他の注目点
Today we get the weekly US API crude oil inventories figure and on a monetary level we note that Fed Board Governor Barr, Chicago Fed President Goolsbee, Fed Board Governor Cook, Fed Vice Chair Bowman and BoE Governor Andrew Bailey speak. In tomorrow’s Asian session, we get Japan’s Tankan indexes for July and machinery orders for May, while from China a slew of data including the GDP rate for Q2.
Charts to keep an eye out
USD/JPY edged higher yesterday yet remained below the 162.80 (Ρ1) resistance line. We maintain a bias for a sideways motion of the pair and the RSI indicator is running along the reading of 50 implying a rather indecisive market, that may allow the sideways motion to continue. Should the bears take over, we may see USD/JPY breaking the 160.50 (S1) support line clearly and start aiming for the 157.50 (S2) support level. Should the bulls be in charge we may see USD/JPY breaking the 162.80 (R1) resistance line which marks a forty year high and we set as the next possible target for the bulls the 165.50 (R2) level. Please note that the possibility of Japanese authorities proceeding with a market intervention operation to the JPY’s rescue grows in alignment with the pair’s bullish tendencies.
WTI’s price action rose yesterday breaking the 76.60 (S1) resistance line, now turned to support. We note the bullish tendencies of the commodity’s price, yet at the same time also note that the market sentiment is currently neutral as the RSI indicator has not clearly surpassed the reading of 50. Should the bulls take over we may see WTI’s price breaking the 82.00 (R1) resistance line with the next possible target for the bulls being set at the 88.60 (R2) resistance level. Should the bears gain control over WTI’s price we may see it breaking the 76.60 (S1) support line, opening the gates for the 71.65 (S2) support level.
USD/JPY Daily Chart
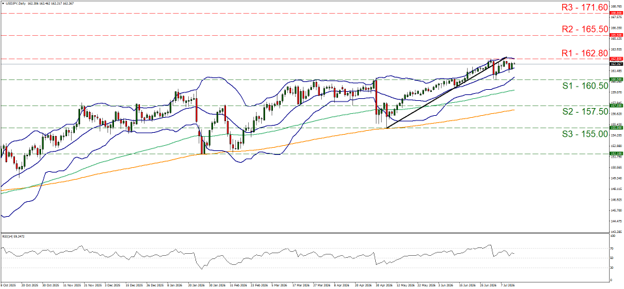
- Support: 160.50 (S1), 157.50 (S2), 155.00 (S3)
- Resistance: 162.80 (R1), 165.50 (R2), 171.60 (R3)
WTI Daily Chart
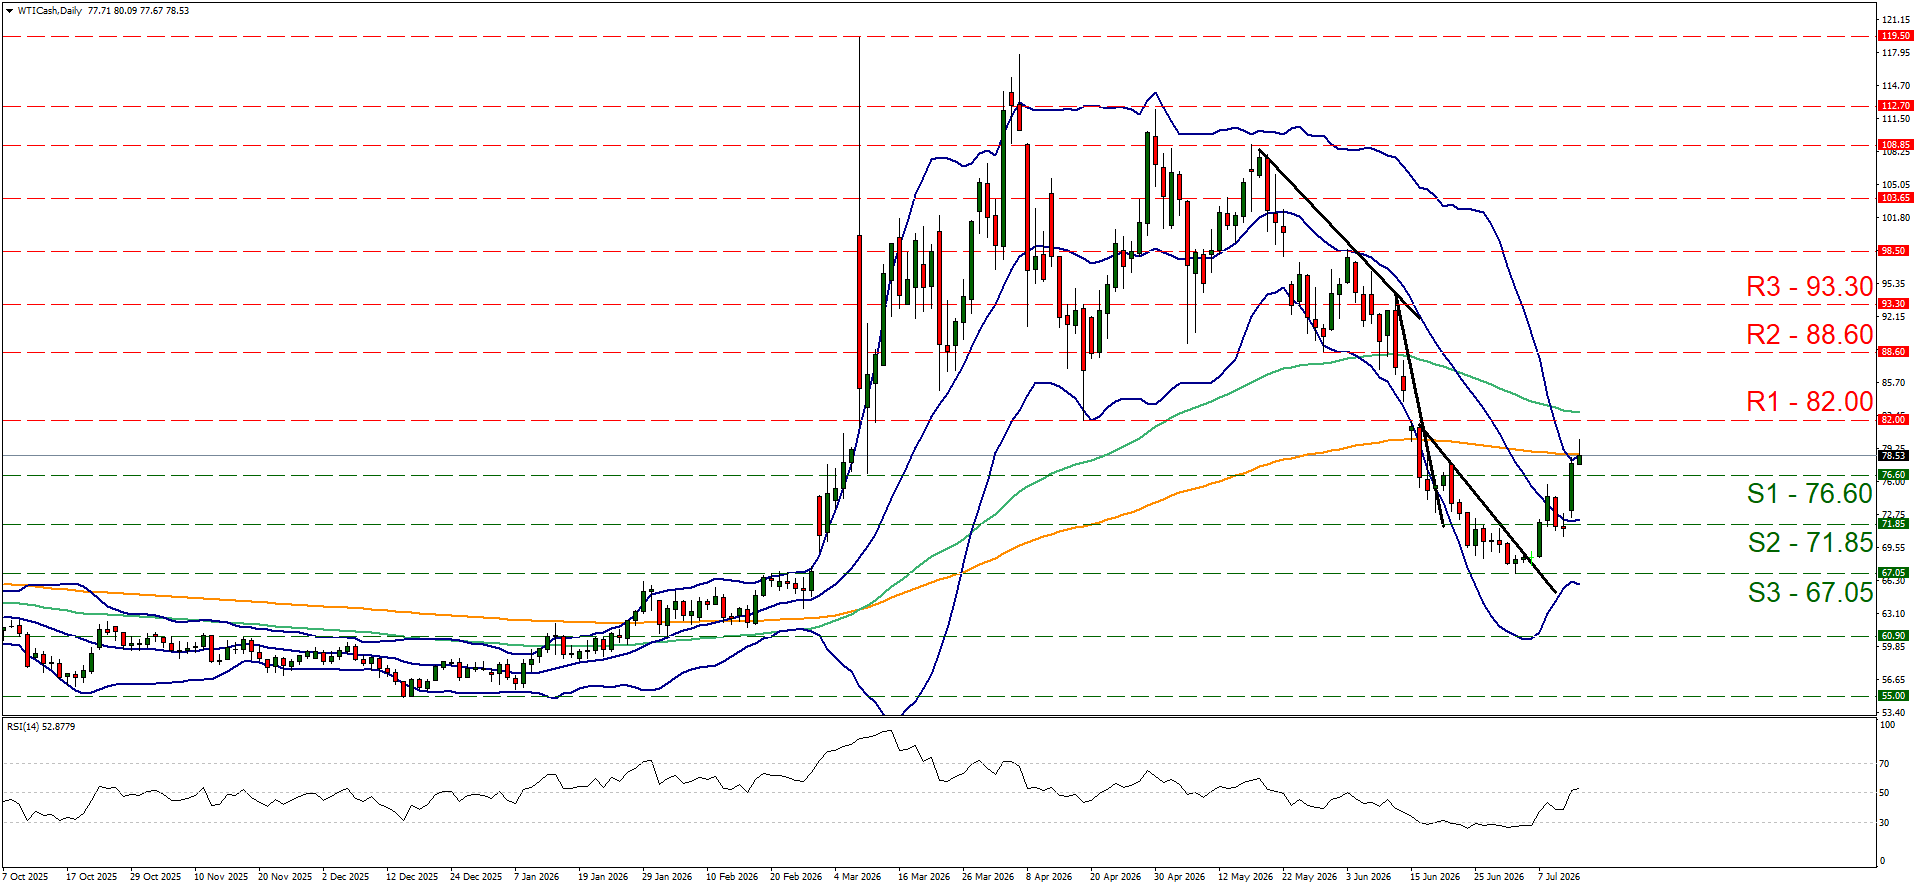
- Support: 76.60 (S1), 71.85 (S2), 67.05 (S3)
- Resistance: 82.00 (R1), 88.60 (R2), 93.30 (R3)
免責事項:
本情報は、投資助言や投資推奨ではなく、マーケティングの一環として提供されています。IronFXは、ここで参照またはリンクされている第三者によって提供されたいかなるデータまたは情報に対しても責任を負いません。


