
Market’s hopes for US-Iran deal remain high, keeping risk appetite supported and pressuring the USD as safe-haven demand fades.
With equity markets extending gains and oil prices retreating, traders remain focused on geopolitical headlines and today’s key economic releases for fresh direction.
USD on the back foot
The USD was on the back foot yesterday as the market’s hopes for a peaceful resolution of the US-Iran conflict intensified. Subsequently, the USD’s safe-haven status tended to weigh. Should we see the market sentiment improving further, we may see the USD retreating further, and vice versa.
US stock markets continue to rise
US stock markets continued to rise as equity bulls seem to continue to get more support from the market’s optimism. Currently, the two factors enhancing the market’s optimism would be the expectations for a diplomatic resolution of the US-Iran conflict and the possibilities of AI as well as the investment flows related to the sector.
Oil prices retreat
Oil prices continued to drop yesterday, as market worries for the US-Iran conflict eased. An Axios report claimed that the US and Iran are closing towards a memorandum of understanding, which could lead towards further negotiations. The Iranians are reported to be considering the US proposal and a possible further easing of the market’s worries could weigh on oil prices.
Bitcoin’s bulls seem to be taking a break
Bitcoin’s price seems to be halting its rise. It’s interesting that Saylor’s Strategy is reported to have started shifting its crypto strategy and is actively considering selling Bitcoin and given the size of the holding we continue monitoring news about it. Also a possible further improvement of the market sentiment could provide some support for the crypto market, given its riskier.
本日のその他の注目点
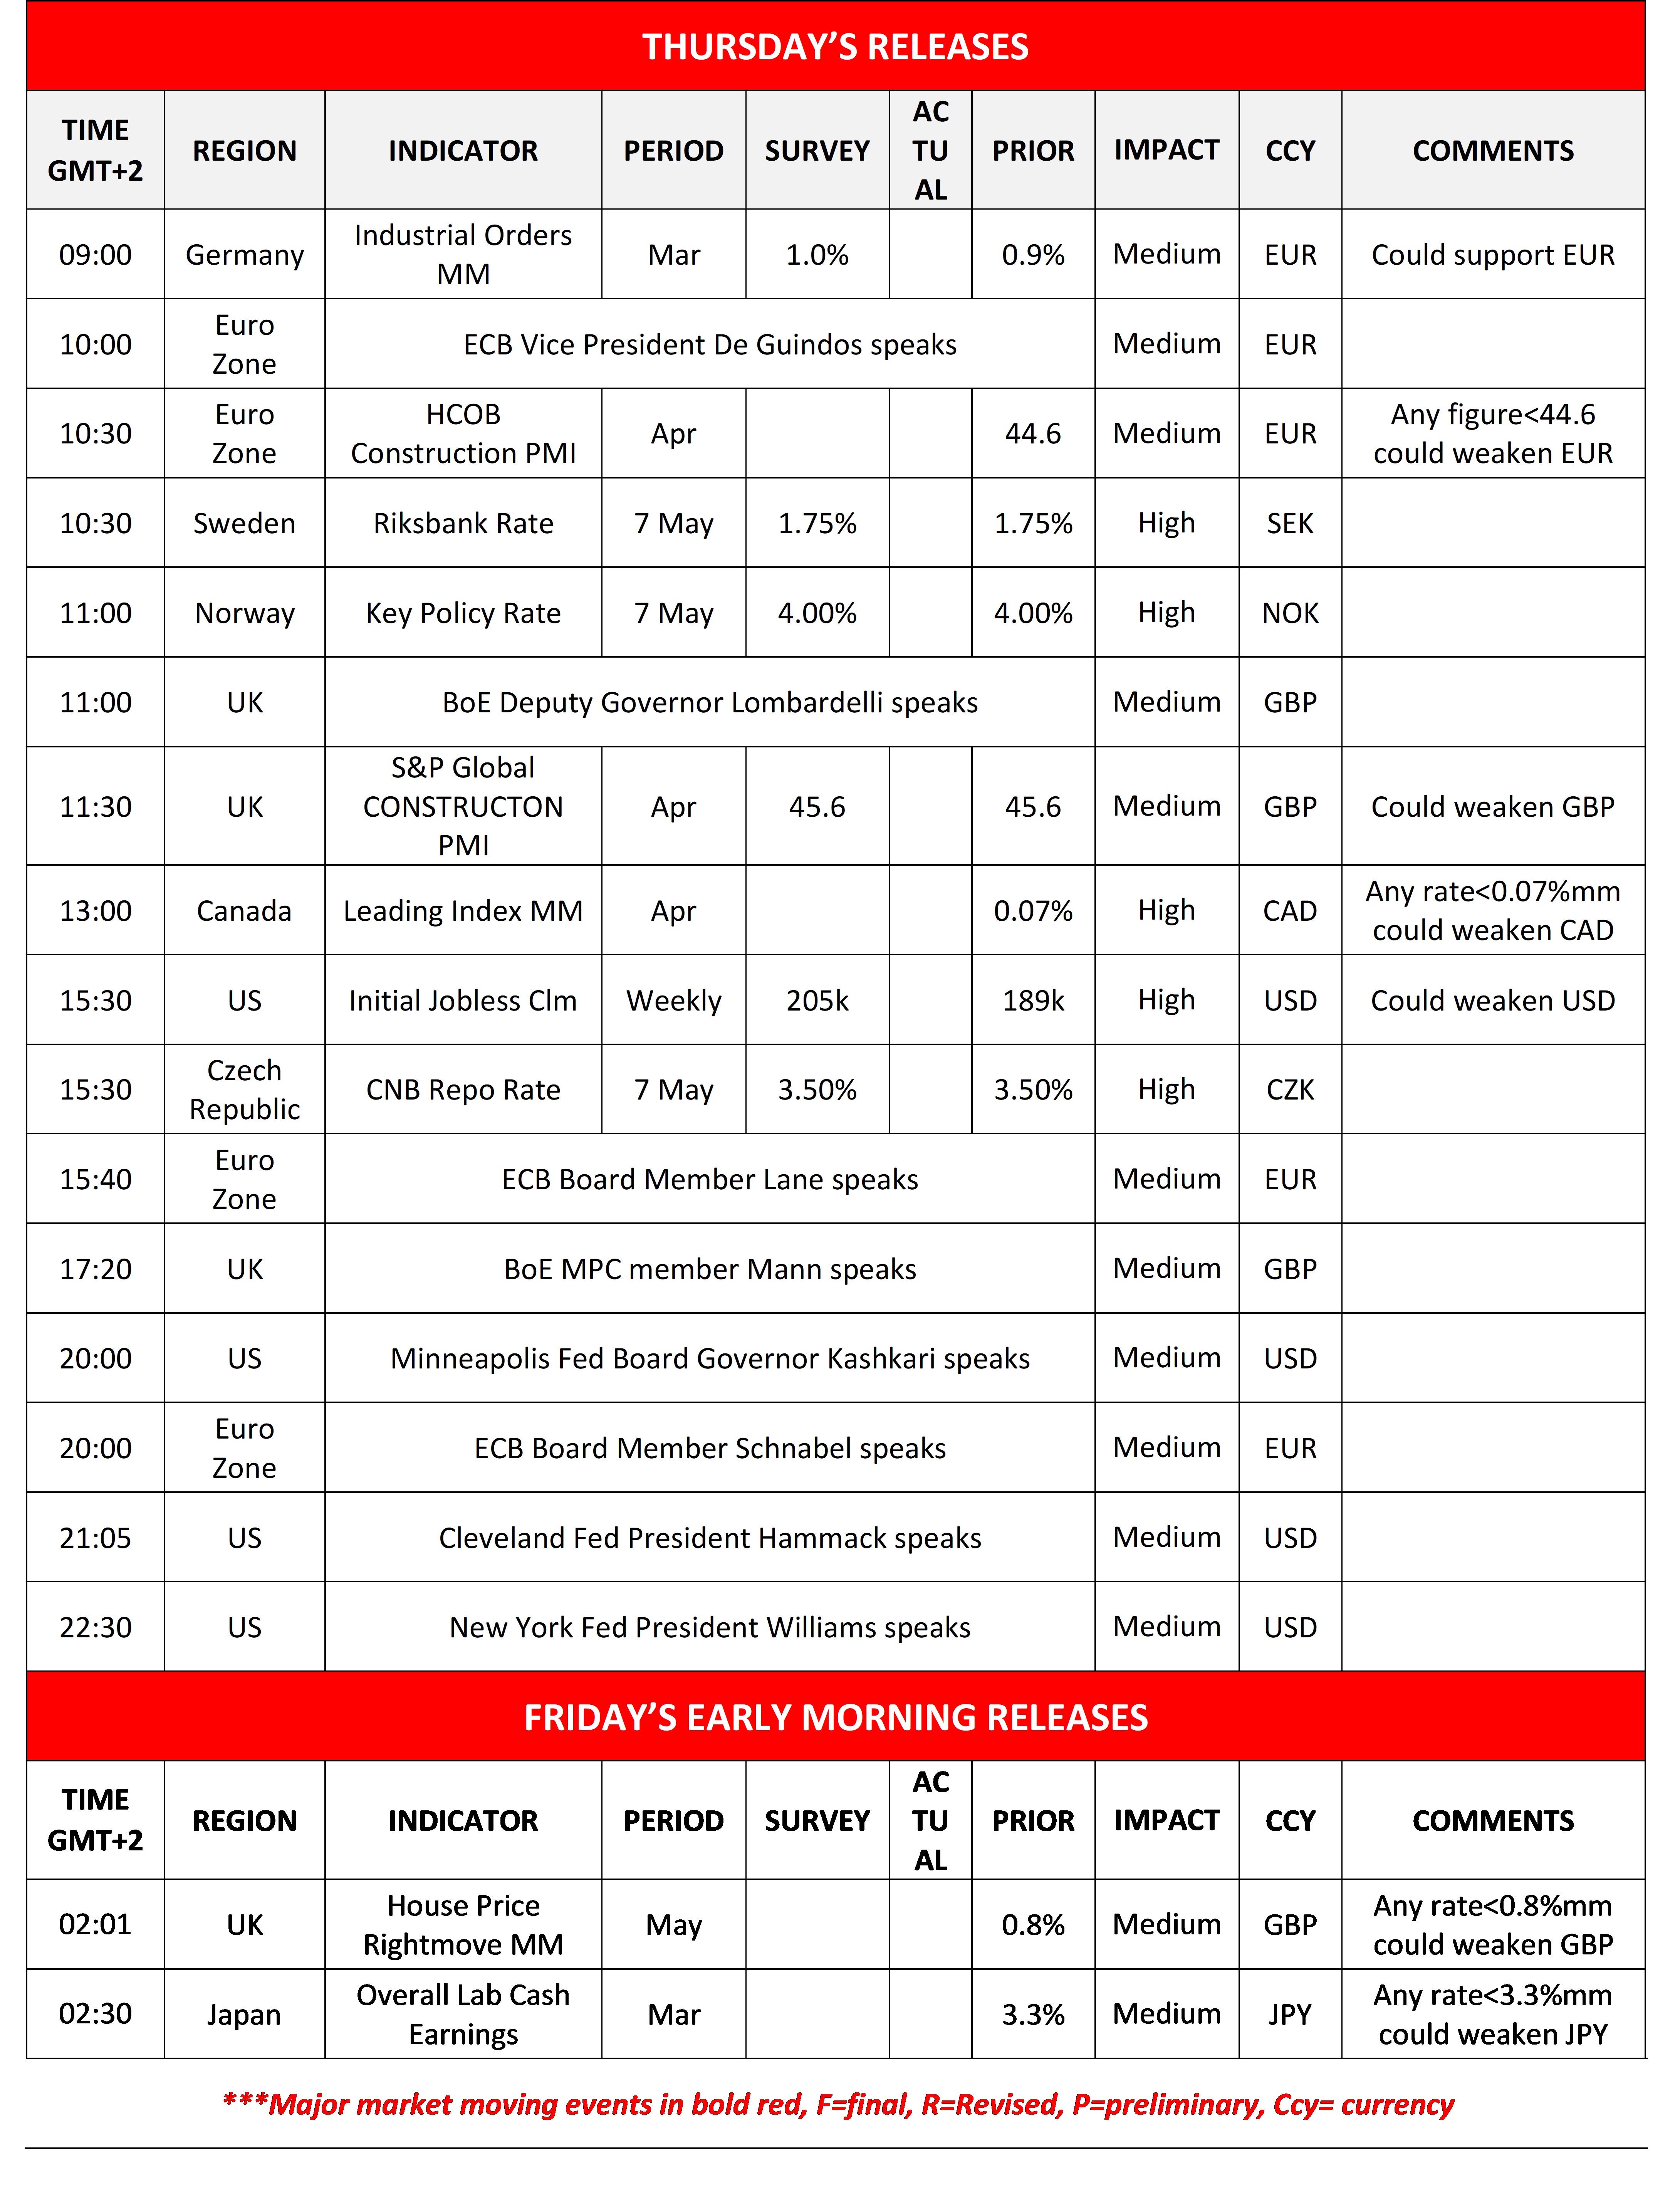
Today we get Germany’s industrial orders for March, Euro Zone’s and the UK’s April construction PMI figure, Canada’s Leading index for April and the US weekly initial jobless claims figure. On a monetary level, we note the interest rate decisions of Riksbank, Norgesbank and CNB, while ECB’s De Guindos, Lane and Schnabel, BoE’s Lombardelli and Mann and the Fed’s Kashkari, Hammack and Williams are speaking. In tomorrow’s Asian session, we get UK’s House Price Rightmove for May and Japan’s Overall Lab cash earnings for March.
Charts to keep an eye out
US100
Nasdaq continued to rise yesterday, nearing the 28750 (R1) resistance line. We maintain a bullish outlook for the index and intend to keep it as long as the upward trendline guiding it, remains intact. We also note that the RSI indicator remains well above the reading of 70, implying a strong bullish market sentiment for the index, yet at the same time may also imply that the index’s price action is at overbought levels, and ripe for a correction lower. Should the bulls take over, we may see the index’s price action breaking the 28750 (R1) resistance line and set as the next possible target for the bulls the 30000 (R2) resistance level. Should the bears take over, we may the index breaking initially the prementioned upward trendline in a first signal of an interruption of its upward movement, continue to break the 27500 (S1) support level and set in its sights the 26250 (S2) support level.
WTI
WTI dropped breaking the 100.90 (R1) support line now turned to resistance and continued to briefly breach the 93.80 (S1) support line, yet corrected higher. We maintain a bias for a continuance of the bearish movement, yet the RSI indicator has dropped to the reading of 50, implying a that a stabilisation of the commodity’s price is also possible. Should the bears maintain control we may see it breaking the 93.80 (S1) support line and start aiming for the 87.10 (S2) support level. Should the bulls take over we may see WTI’s price breaking the 100.90 (R1) resistance line and start aiming for the 107.00 (R2) level.
US100 Cash デイリーチャート
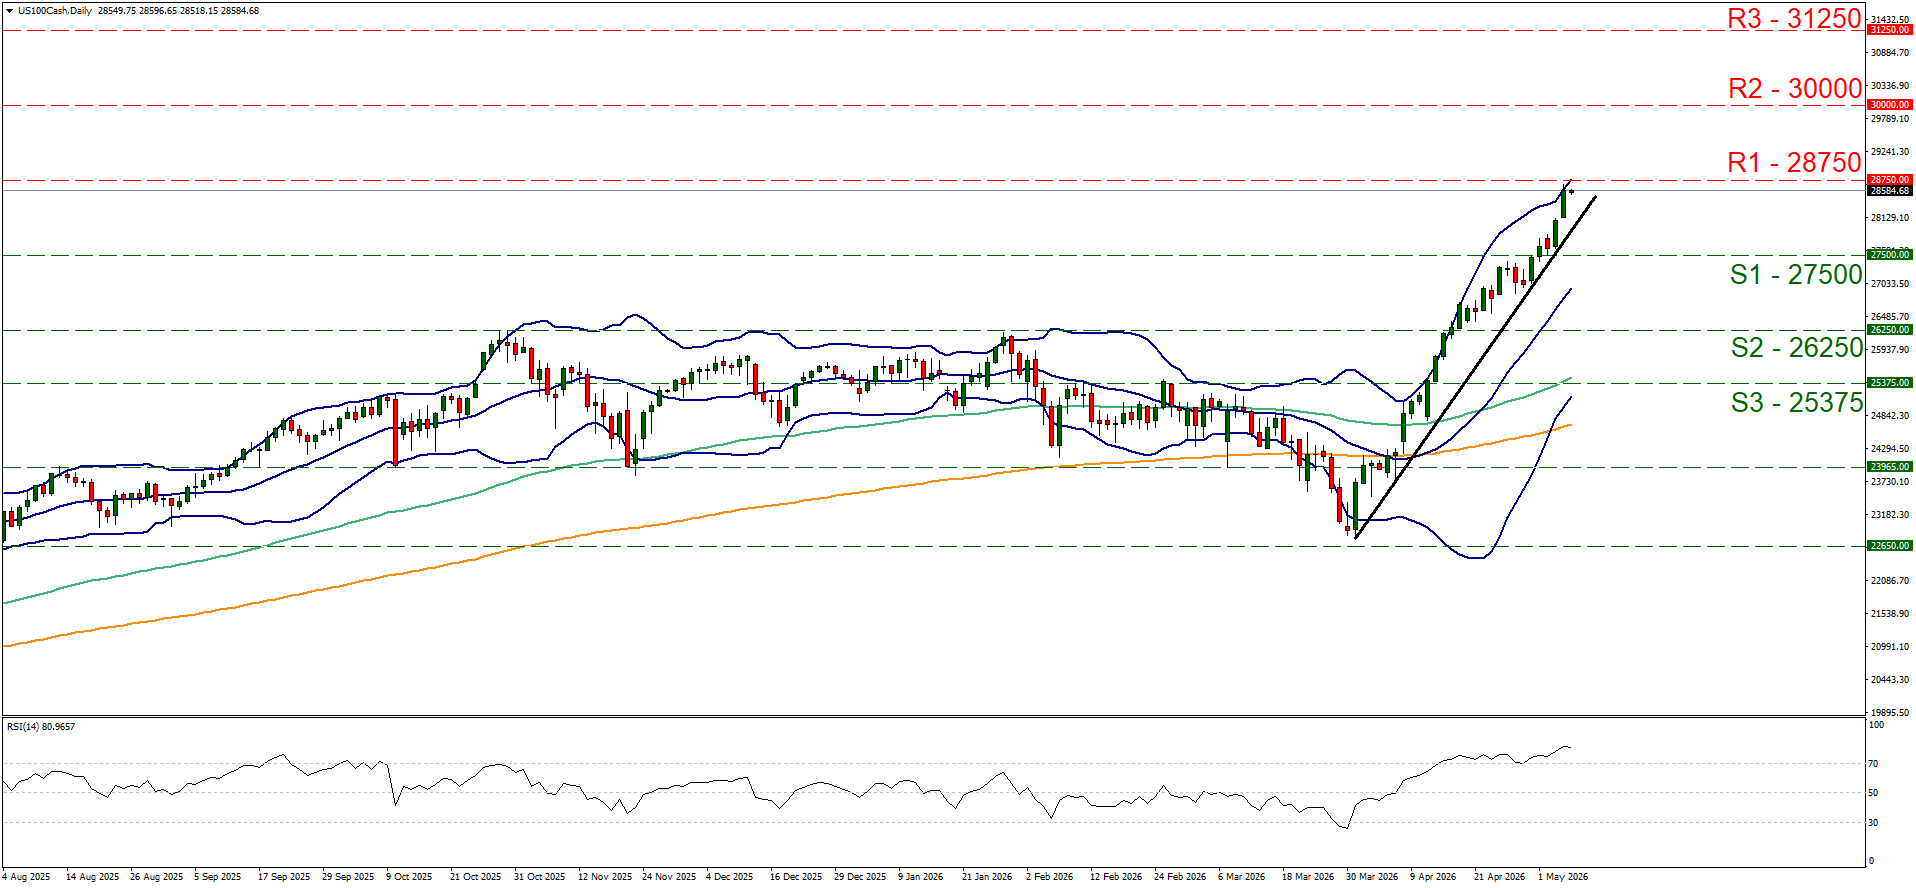
- Support: 27500 (S1), 26250 (S2), 25375 (S3)
- Resistance: 28750 (R1), 30000 (R2), 31250 (R3)
WTI Daily Chart
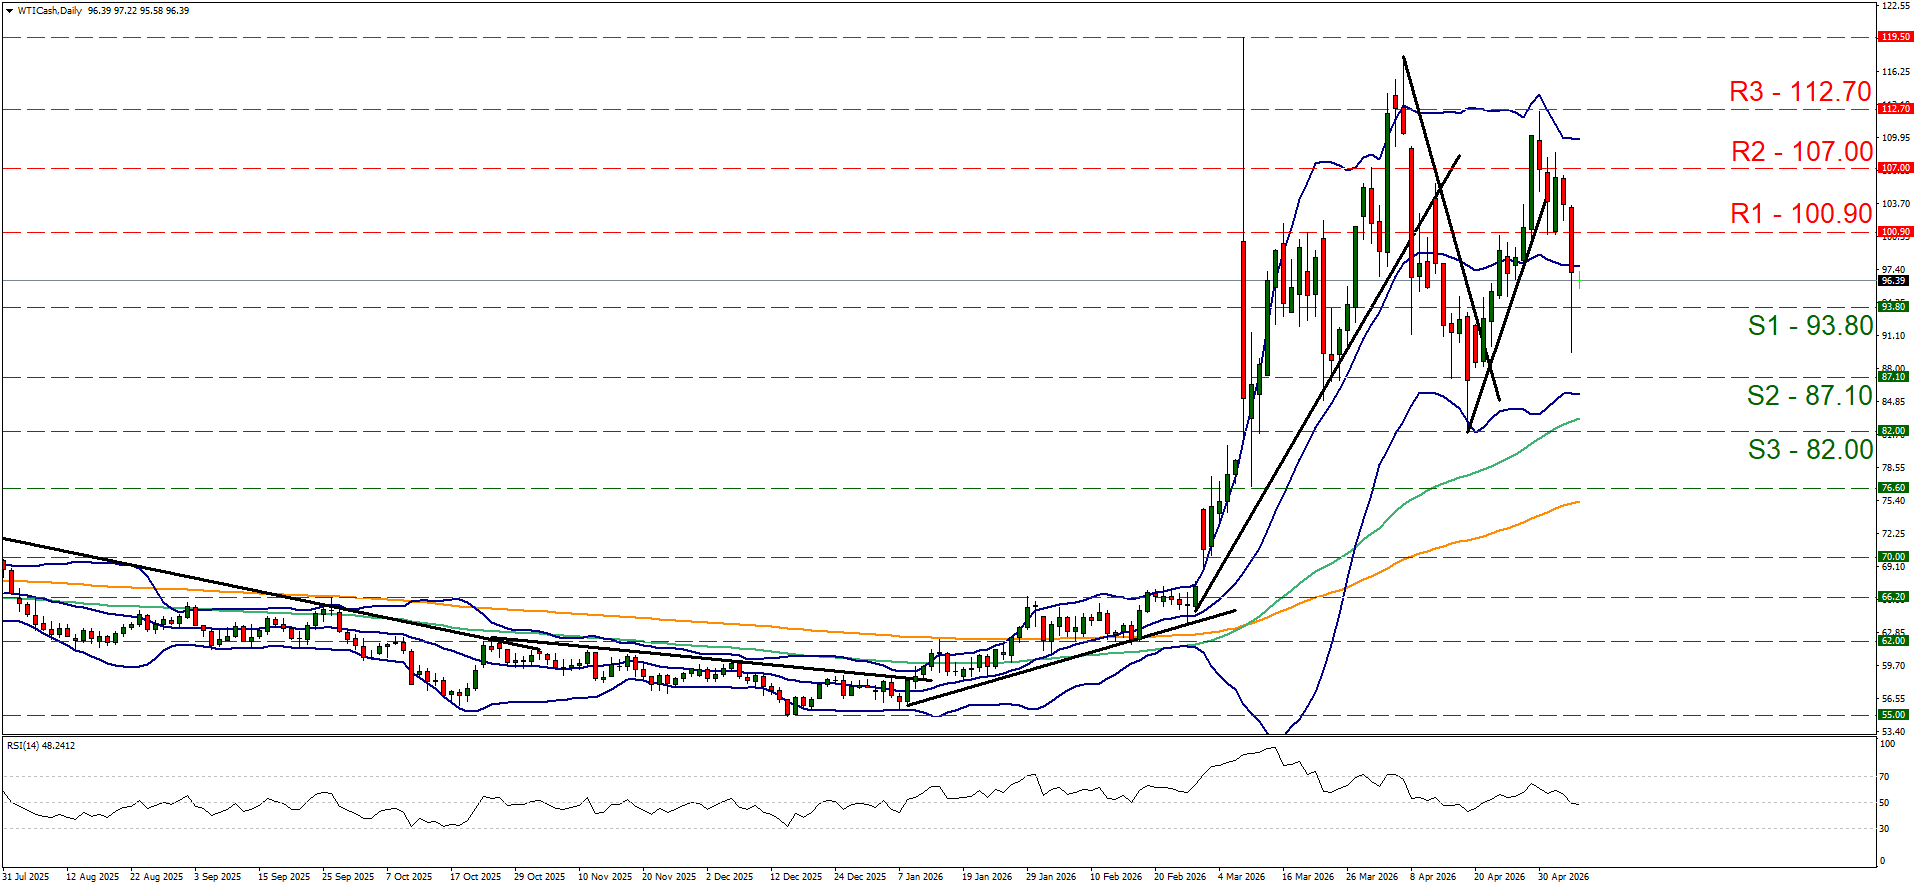
- Support: 93.80 (S1), 87.10 (S2), 82.00 (S3)
- Resistance: 100.90 (R1), 107.00 (R2), 112.70 (R3)
免責事項:
本情報は、投資助言や投資推奨ではなく、マーケティングの一環として提供されています。IronFXは、ここで参照またはリンクされている第三者によって提供されたいかなるデータまたは情報に対しても責任を負いません。