

High market hopes for the Xi-Trump meeting have fueled optimism across financial markets, boosting US stocks and supporting the USD. While the pound shows sideways movement amid domestic political pressures, oil and gold prices face downward pressures, reflecting a mix of geopolitical and monetary influences.
USD continues to rise, focus also on the pound
The USD continued to surge in the FX market as expected in yesterday’s report, supported by market expectations for the Fed to keep its monetary policy tight, if not tighten it even further. We also highlight the US President Trump’s visit to China, and any improvement of the US-Sino relationships could weigh on the USD somewhat as market worries may ease. In the FX market, we continue to monitor the GBP with UK’s GDP rates accelerating beyond expectations which was a positive, yet at the same time note that the increased pressure UK PM Starmer is facing to resign may weigh on the sterling.
US stock markets continue to gain
US stock markets continued to rise yesterday as market hopes for a possible improvement of the US-Chinese trade relationship were enhanced. The rise may have been capped by the market’s hawkish expectations for the Fed, albeit confirmation of Warsh as the Fed Chairman, may be counterbalancing such expectations somewhat.
Oil prices hit the pause button
Oil prices edged lower yesterday and during today’s Asian session. It’s as if oil trader’s hopes are up, as they navigate through the developments in the US-Iranian conflict, the Trump-Xi meeting in China and a tight US oil market. We expect further developments in the next couple of days with the fundamental mix being quite liquid for the oil market currently.
Gold’s price continues to edge lower
Gold’s price continued to edge lower as the strengthening of the USD seemed to weigh. Once again, we note the inverse relationship between the USD and gold’s price and expect any further strengthening of the USD to enhance bearish tendencies for the gold’s price. Nevertheless, we also note that the deviation of the two trading instruments is asymmetric.
دیگر نکات مهم امروز
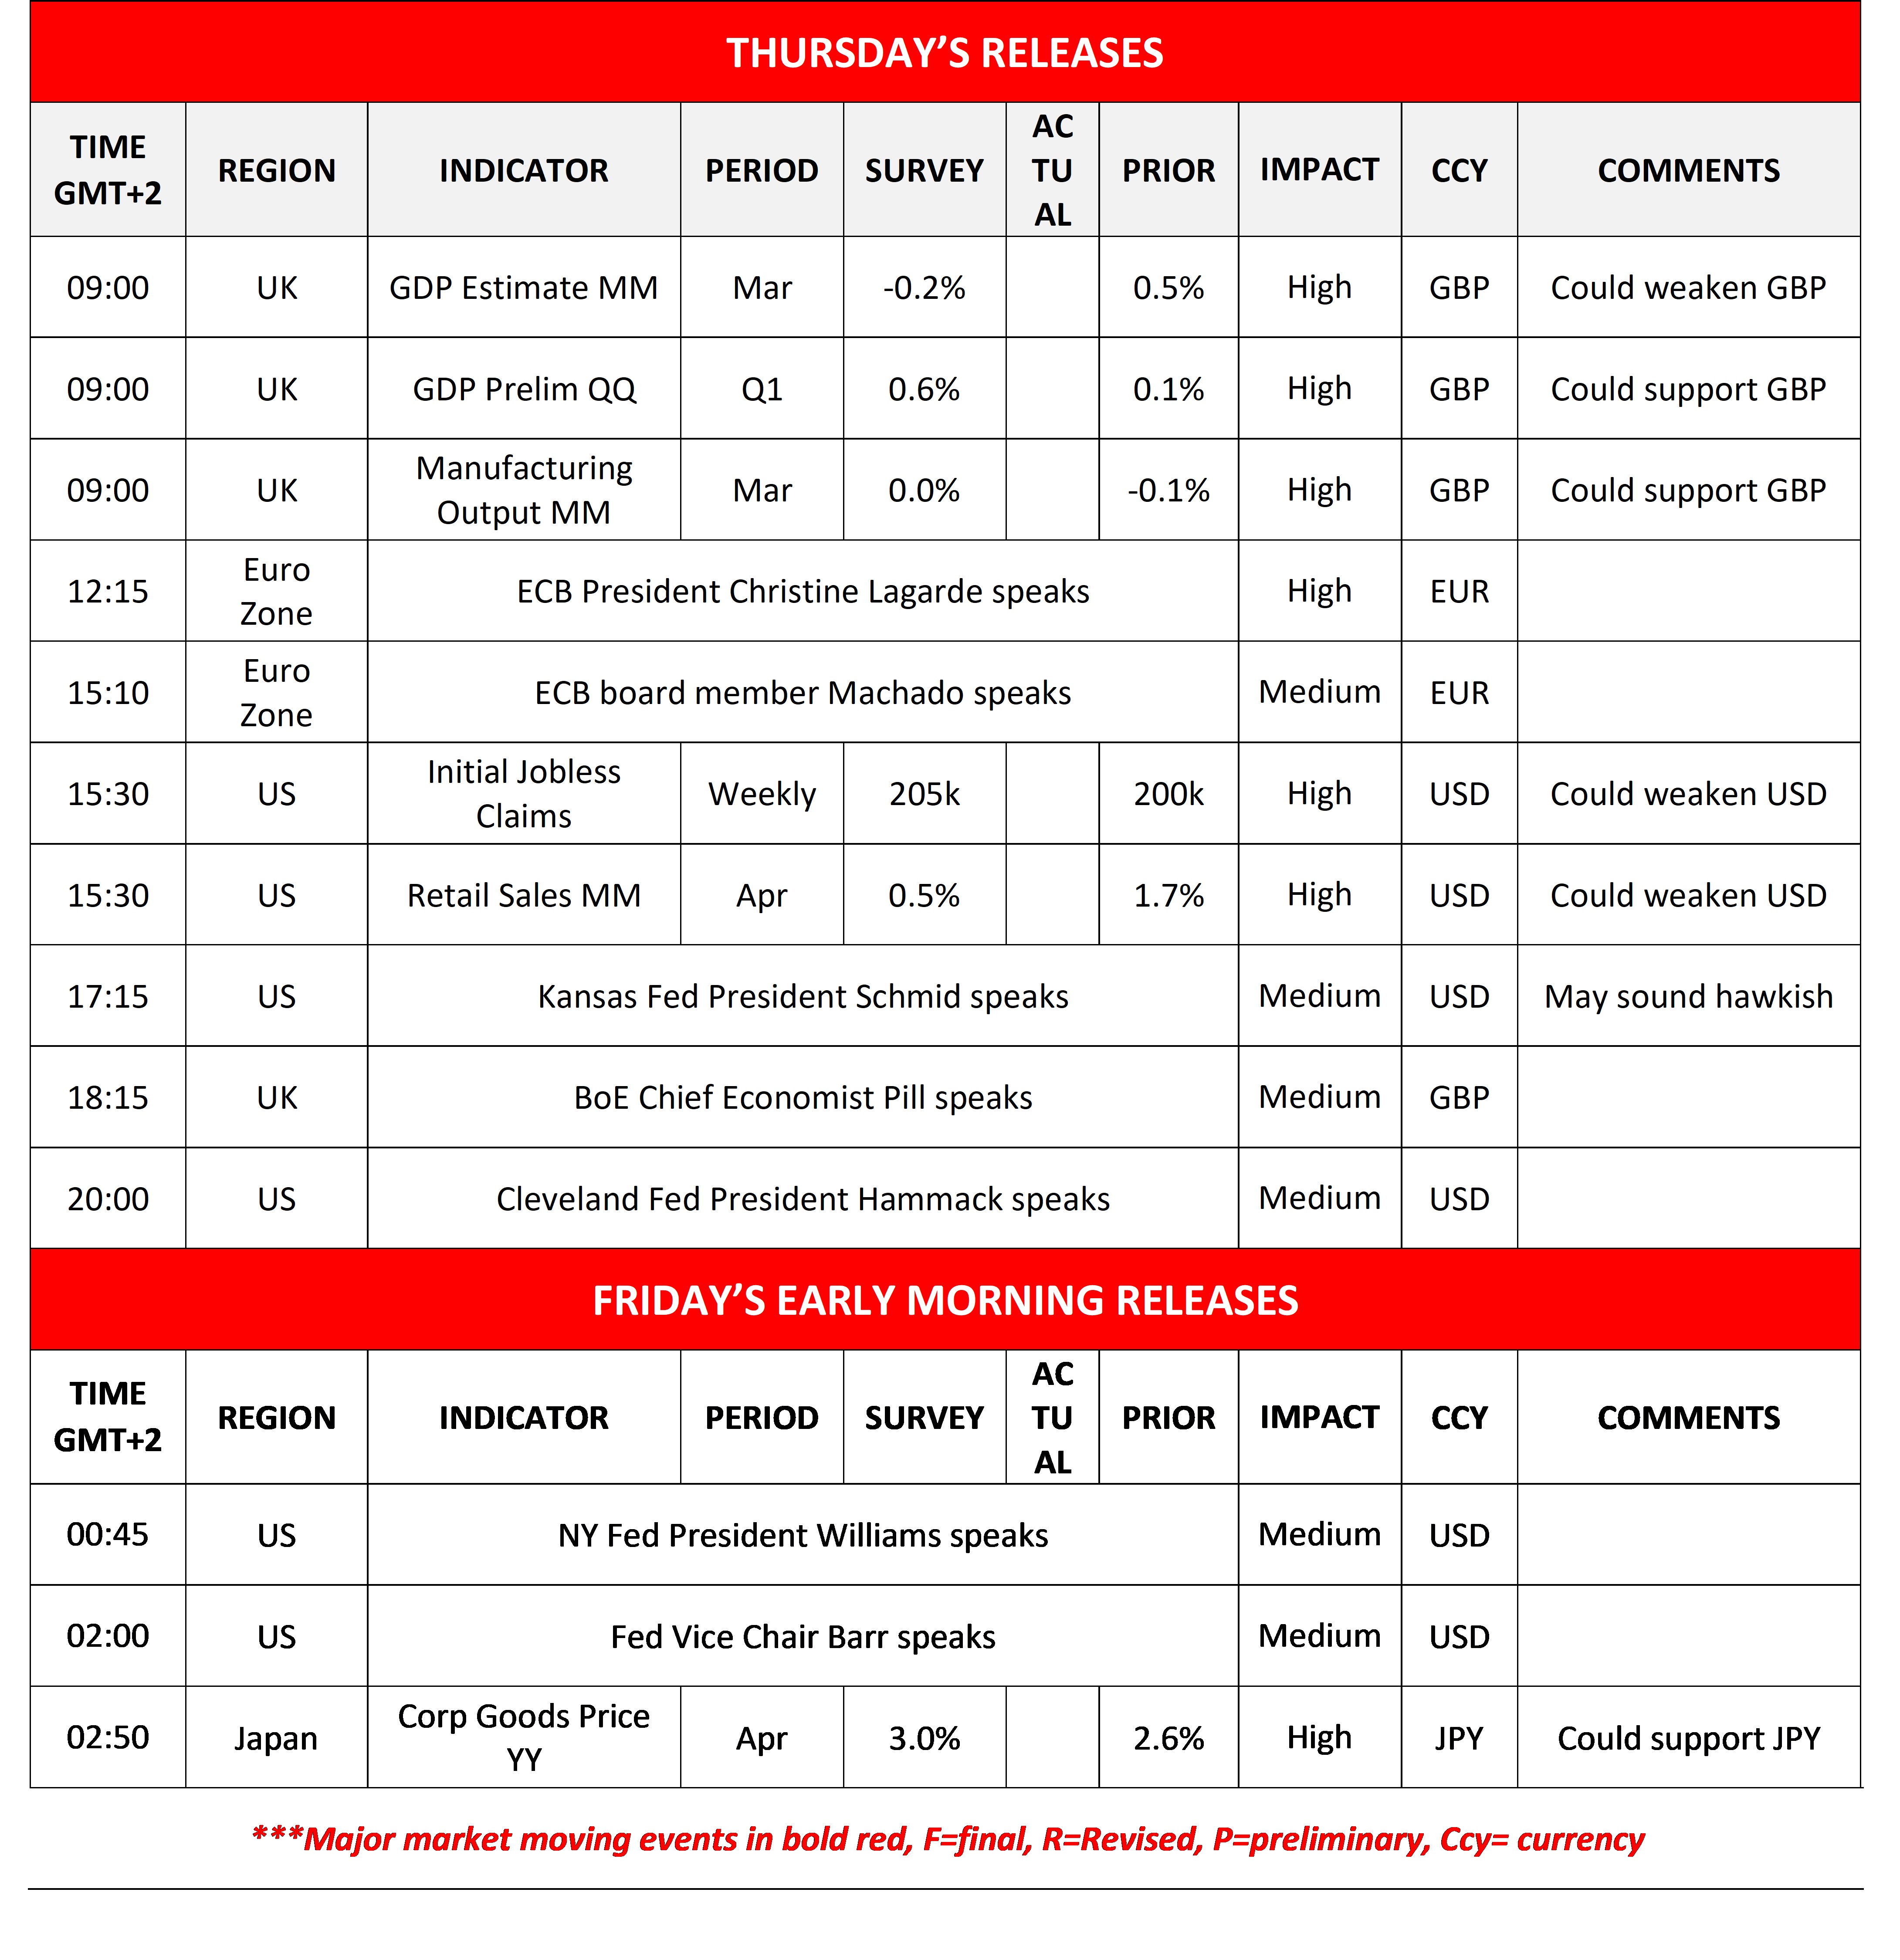
Today we get UK’s GDP rates for Q1 and March, the weekly US initial jobless claims figure and retail sales for April. We also note that ECB’s President Christine Lagarde and Machado, Kansas Fed President Schmid, BoE’s Pill and Cleveland Fed President Hammack speak. In tomorrow’s Asian session, we get Japan’s PPI rates for April while Fed’s Williams and Barr speak.
Charts to keep an eye out
GBP/USD
GBP/USD continued to edge lower yesterday, yet remains well within the boundaries set between the 1.3590 (R1) resistance line and the 1.3385 (S1) support level.
We maintain a bias for a sideways motion of the pair between the prementioned levels and note that the RSI indicator is running along the reading of 50, implying a relative indecisive market which could allow for the sideways motion to continue.
Similar signals come from the narrowing Bollinger Bands. Should the bulls take over, we may see GBP/USD breaking the 1.3590 (R1) resistance line and start aiming for the 1.3790 (R2) resistance level. Should the bears take over, we may see EUR/USD breaking the 1.3385 (S1) support line and start aiming for the 1.3175 (S2) support level.
Nasdaq
Nasdaq’s reentered green territory yesterday aiming for the 30000 (R1) resistance line.
We maintain our bullish outlook as long as the upward trendline guiding it higher since the 31 of March, yet are quite worried that the index is at overbought levels and a correction lower could be imminent.
Should the bulls maintain control, we set as the next possible target for the bulls the 30000 (R1) resistance level. Should the bears take over, we may see Nasdaq’s price action breaking initially the prementioned upward trendline, continue to break also the 28750 (S1) line and start aiming for the 27500 (S2) support level.
GBP/USD Daily Chart
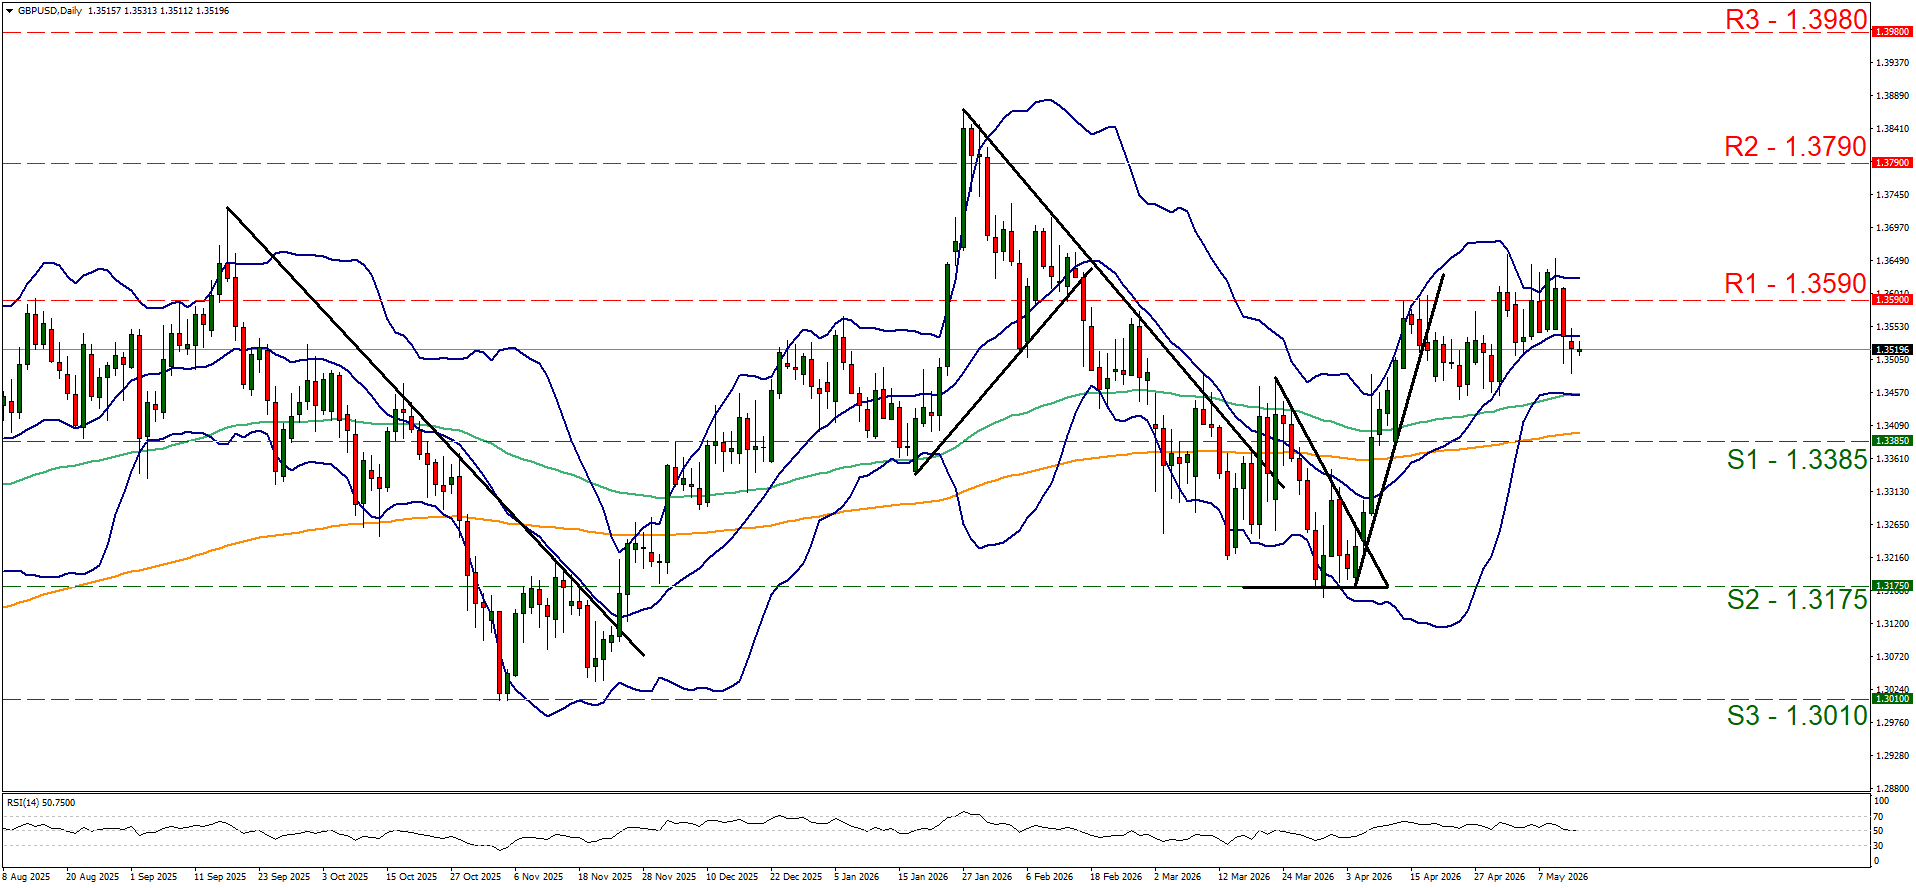
- Support: 1.3385 (S1), 1.3175 (S2), 1.3010 (S3)
- Resistance: 1.3590 (R1), 1.3790 (R2), 1.3980 (R3)
US100 Daily Chart
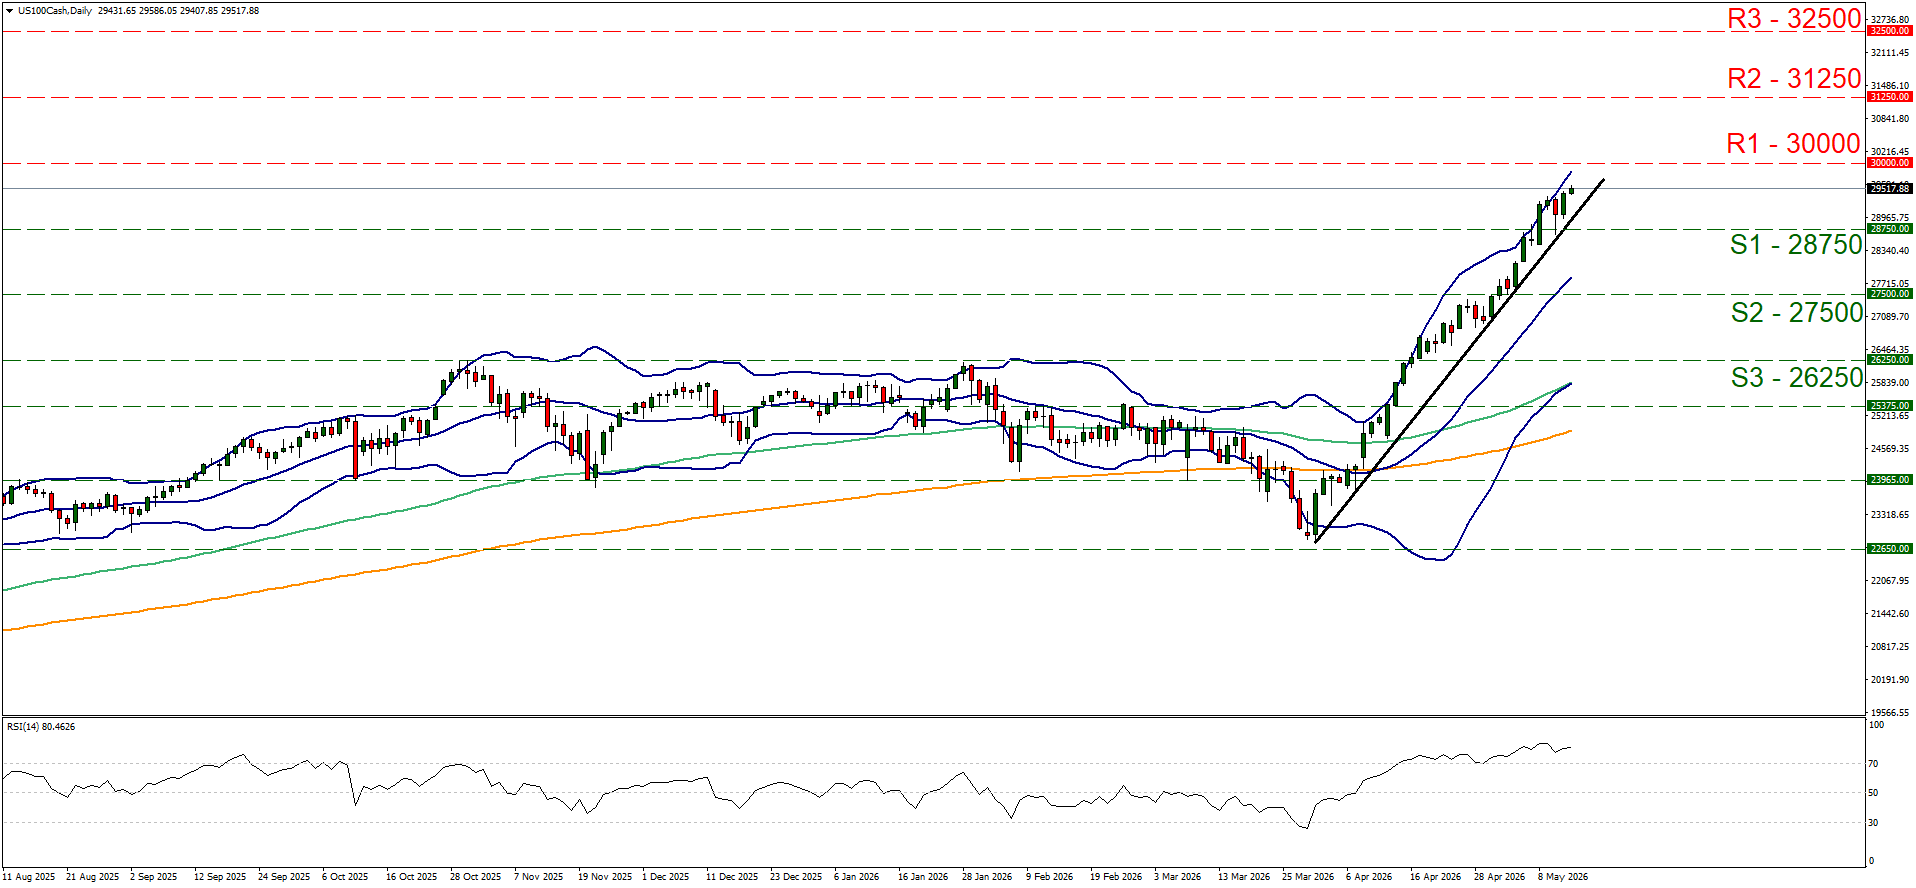
- Support: 28750 (S1), 27500 (S2), 26250 (S3)
- Resistance: 30000 (R1), 31250 (R2), 32500 (R3)
سلب مسئولیت:
این اطلاعات به عنوان مشاوره سرمایه گذاری یا توصیه سرمایه گذاری در نظر گرفته نمی شود ، بلکه در عوض یک ارتباط بازاریابی است. IronFX هیچ گونه مسئولیتی در قبال داده ها یا اطلاعاتی که توسط اشخاص ثالث در این ارتباطات ارجاع و یا پیوند داده شده اند ندارد.
