 FA
 EN
 FR
 ES
 JA
 KO
 PT
 ZH
 AR
 RU
 NL
 MS
 VI
 PH
 TH
 ID



Price gaps are one of those chart patterns traders tend to notice right away, but they’re not always easy to interpret. Whether you’re trading stocks, forex, or commodities, understanding the difference between a gap up and a gap down can completely change the way you read a chart and spot potential market moves.
What Is a Price Gap?
A price gap happens when an asset opens noticeably higher or lower than where it closed in the previous session, leaving a visible space on the chart where no trading took place. That empty space can actually tell you a lot about what happened in the market.

These moves often appear after major news, earnings announcements, or important economic data releases. They can also form when sentiment changes overnight or over a weekend, with the market opening at a price that reflects the latest developments.
For example, MarketWatch reported on a rare three-day run of upward moves in the S&P 500 ETF, but historical analysis suggested that this pattern wasn’t necessarily a bullish signal in the short term. And that’s what makes these patterns interesting: they can offer useful clues, but they need to be read in context.
Gap Up vs Gap Down Explained
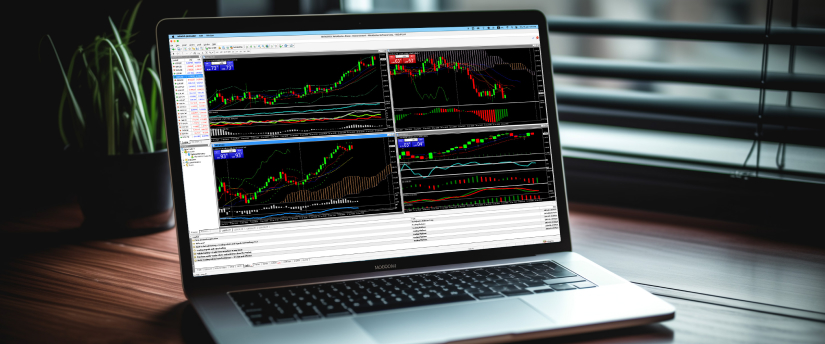
What Is a Gap Up?
A gap up occurs when an asset opens above its previous closing price, creating a visible space on the chart below the new candle.
This can happen for several reasons, including:
- A company reports better-than-expected earnings after the previous session
- Positive economic data is released before the market opens
- A major geopolitical development pushes market sentiment in a bullish direction
A gap can signal strong buying interest and positive momentum, but it doesn’t automatically mean prices will keep climbing. In some cases, a large price jump suggests that many buyers have already entered, leaving less room for further gains in the short term.
What Is a Gap Down?
A gap down is the opposite of a gap up. It happens when an asset opens below its previous closing price, leaving a visible space above the current price on the chart.
This type of move often follows disappointing earnings, negative news, or a broader market sell-off. It can signal a sudden shift in sentiment, concerns about a company’s fundamentals, or simply a reaction to events that occurred while the market was closed.
The size of the move matters, too. A small decline following a quiet news cycle can mean something very different from a sharp drop triggered by a major announcement. Looking at the size of the move alongside the news and broader market conditions can give traders a clearer picture of what’s driving the price action.
The Four Main Types of Price Gaps

Not all price gaps mean the same thing. Traders generally divide them into four main categories, each offering different clues about what the market may be doing.
Common gaps tend to appear during quieter, low-volatility periods and may fill relatively quickly. On their own, they usually don’t tell traders much about the broader market picture.
Breakaway gaps often appear when an asset moves out of a consolidation phase. They can signal the beginning of a new trend, suggesting that the market has finally picked a direction after a period of indecision.
Runaway gaps, also known as measuring gaps, typically occur in the middle of a strong trend. Rather than pointing to a reversal, they may indicate that existing momentum is building and the trend could have further to run.
Exhaustion gaps tend to appear toward the end of an established trend. They may suggest that buying or selling pressure is starting to run out of steam. However, this pattern alone isn’t enough to confirm a reversal, so traders often look for confirmation from other technical indicators and price action.
Do Gaps Always Fill?
You’ll often hear traders say that “gaps always fill.” The idea is that price will eventually return to the area where the move began.
But that’s a bit too simplistic. Some do close, but not all of them, and the timing can vary significantly. A runaway gap, for example, can remain open for weeks or even months, and in some cases, it may never fully close.
Treating gap-filling as a rule rather than a possibility can be a costly mistake. A better way to think about it is that these price areas can sometimes draw the market back toward them, but this is a tendency to watch, not a certainty to trade on.
How Traders Use Gap Up vs Gap Down in Their Analysis
Understanding gap up vs gap down is only half the job. Knowing how to respond to them is where the practical value lies.
Fading the Gap
Some traders look to trade against the gap, expecting it to fill. If a stock gaps up sharply on thin volume, they may look for signs of reversal near the open.
Trading the Continuation
Others choose to trade in the same direction as the move, particularly when it is a breakaway or runaway pattern. For example, a strong move higher, accompanied by high trading activity and aligned with an existing uptrend, may give traders additional confidence in a long position.
Waiting for Confirmation
A third approach is simply to wait. Instead of acting immediately, some traders let the first 30 to 60 minutes of the session play out before making a decision. The early price action can provide a clearer idea of whether the gap has enough momentum to continue or whether the move is starting to fade.
There is no single approach that works best in every situation. The right choice depends on the market context, your timeframe, and the asset you’re trading.
Gap Up vs Gap Down in Forex
Forex gaps are less common during the trading week because the market operates around the clock. They can still appear at the Sunday open, however, when trading resumes after the weekend. Any major news or events that happened on Saturday or Sunday can be reflected in prices as the market reopens.
A weekend move higher in a currency pair could be driven by a change in risk sentiment, an unexpected policy announcement, or a major geopolitical development. Traders who keep positions open over the weekend are exposed to this risk, which is one reason some short-term traders choose to close their positions before Friday’s market close.
The same analysis can be applied across different asset classes, although the reasons behind these price moves can vary. The concepts are relevant across a range of markets, including indices, forex pairs, and commodities.
Reading Gaps Alongside Other Indicators
Price gaps are much more useful when you look at them in context rather than on their own.
Volume, for example, can help show how much conviction is behind a move. An opening higher than the previous close, accompanied by unusually high trading activity, may suggest stronger participation from buyers. On the other hand, the same move on low volume may deserve a more cautious interpretation.
For a clearer picture, combine this analysis with support and resistance levels, the overall trend, and momentum indicators. Looking at one price move in isolation can leave out important information that could change how you interpret the market.
Putting Gap Analysis to Work
Price gaps are easy to spot and can reveal a lot about what’s happening in the market, especially when you know what to look for. The gap up versus gap down distinction is a useful starting point, but the type of move, the broader market context, and what happens in the hours that follow can be just as important.
A good place to start is by looking for gaps on charts you already follow. Pay attention to what caused the gap, how price moved afterward, and whether the gap eventually filled. Over time, keeping track of these patterns can help you build the kind of market awareness that supports your trading decisions.
Charting tools can also make it easier to spot and monitor gap up vs gap down patterns across different asset classes. If you want to put these ideas into practice, starting with a demo account can be a simple, low-pressure way to explore how gaps behave in live markets.
DISCLAIMER: This content is for general informational and educational purposes only and should not be considered investment advice or investment recommendation.

