
Global markets opened the week with a cautious tone as investors weighed mixed macroeconomic signals and shifting geopolitical risks, including the US-Iran deal close, but still elusive narrative that continues to influence risk sentiment.
While the USD remains broadly stable, traders are balancing safe-haven demand against expectations of upcoming US data releases and central bank commentary.
Equities stay supported by AI-driven optimism, yet concerns over inflation, monetary policy, and geopolitical uncertainty keep volatility in play.
USD remains steady in the FX market
The USD edged higher yesterday, yet the overall picture of its movement is of stability. The greenback remains sensitive to safe haven flows, with an eye fixed on developments in the Middle East. Market focus is also expected to be placed on the release of May’s US employment report on Friday. Across the pond, EUR traders are anticipating the release of Euro Zone’s preliminary HICP rate for May, while from Australia, we get the GDP rate for Q1 in tomorrow’s Asian session.
After SpaceX, OpenAI now also Anthropic goes public
US stock markets remained confident as the week began yesterday, reaching new record high levels. The potentials of AI technology may still be the main market mover for US equities, but also market expectations for the Fed’s intentions and developments in the Middle East are moving US equities. Also, we highlight that besides the SpaceX mega IPO on the 12th of June also AI giant Anthropic is about to go public along with OpenAI.
Oil prices slip on US-Iran deal expectations
Oil prices slipped in today’s Asian session, as market concerns for the tensions in the Middle East seem to be easing. US President Trump, stated yesterday that negotiations with Iran were ongoing, and a possible deal could be reached within the next week. The Iranians reportedly suspended negotiations and stay firm about their nuclear program and a peace deal in Lebanon.
Gold’s price slips
Gold prices dropped yesterday yet recovered any losses made today. On the one hand the negative correlation of gold’s price with the USD remains active while also the market expectations for central banks especially the Fed, to keep a tight monetary policy tends to weigh on the precious metal’s price.
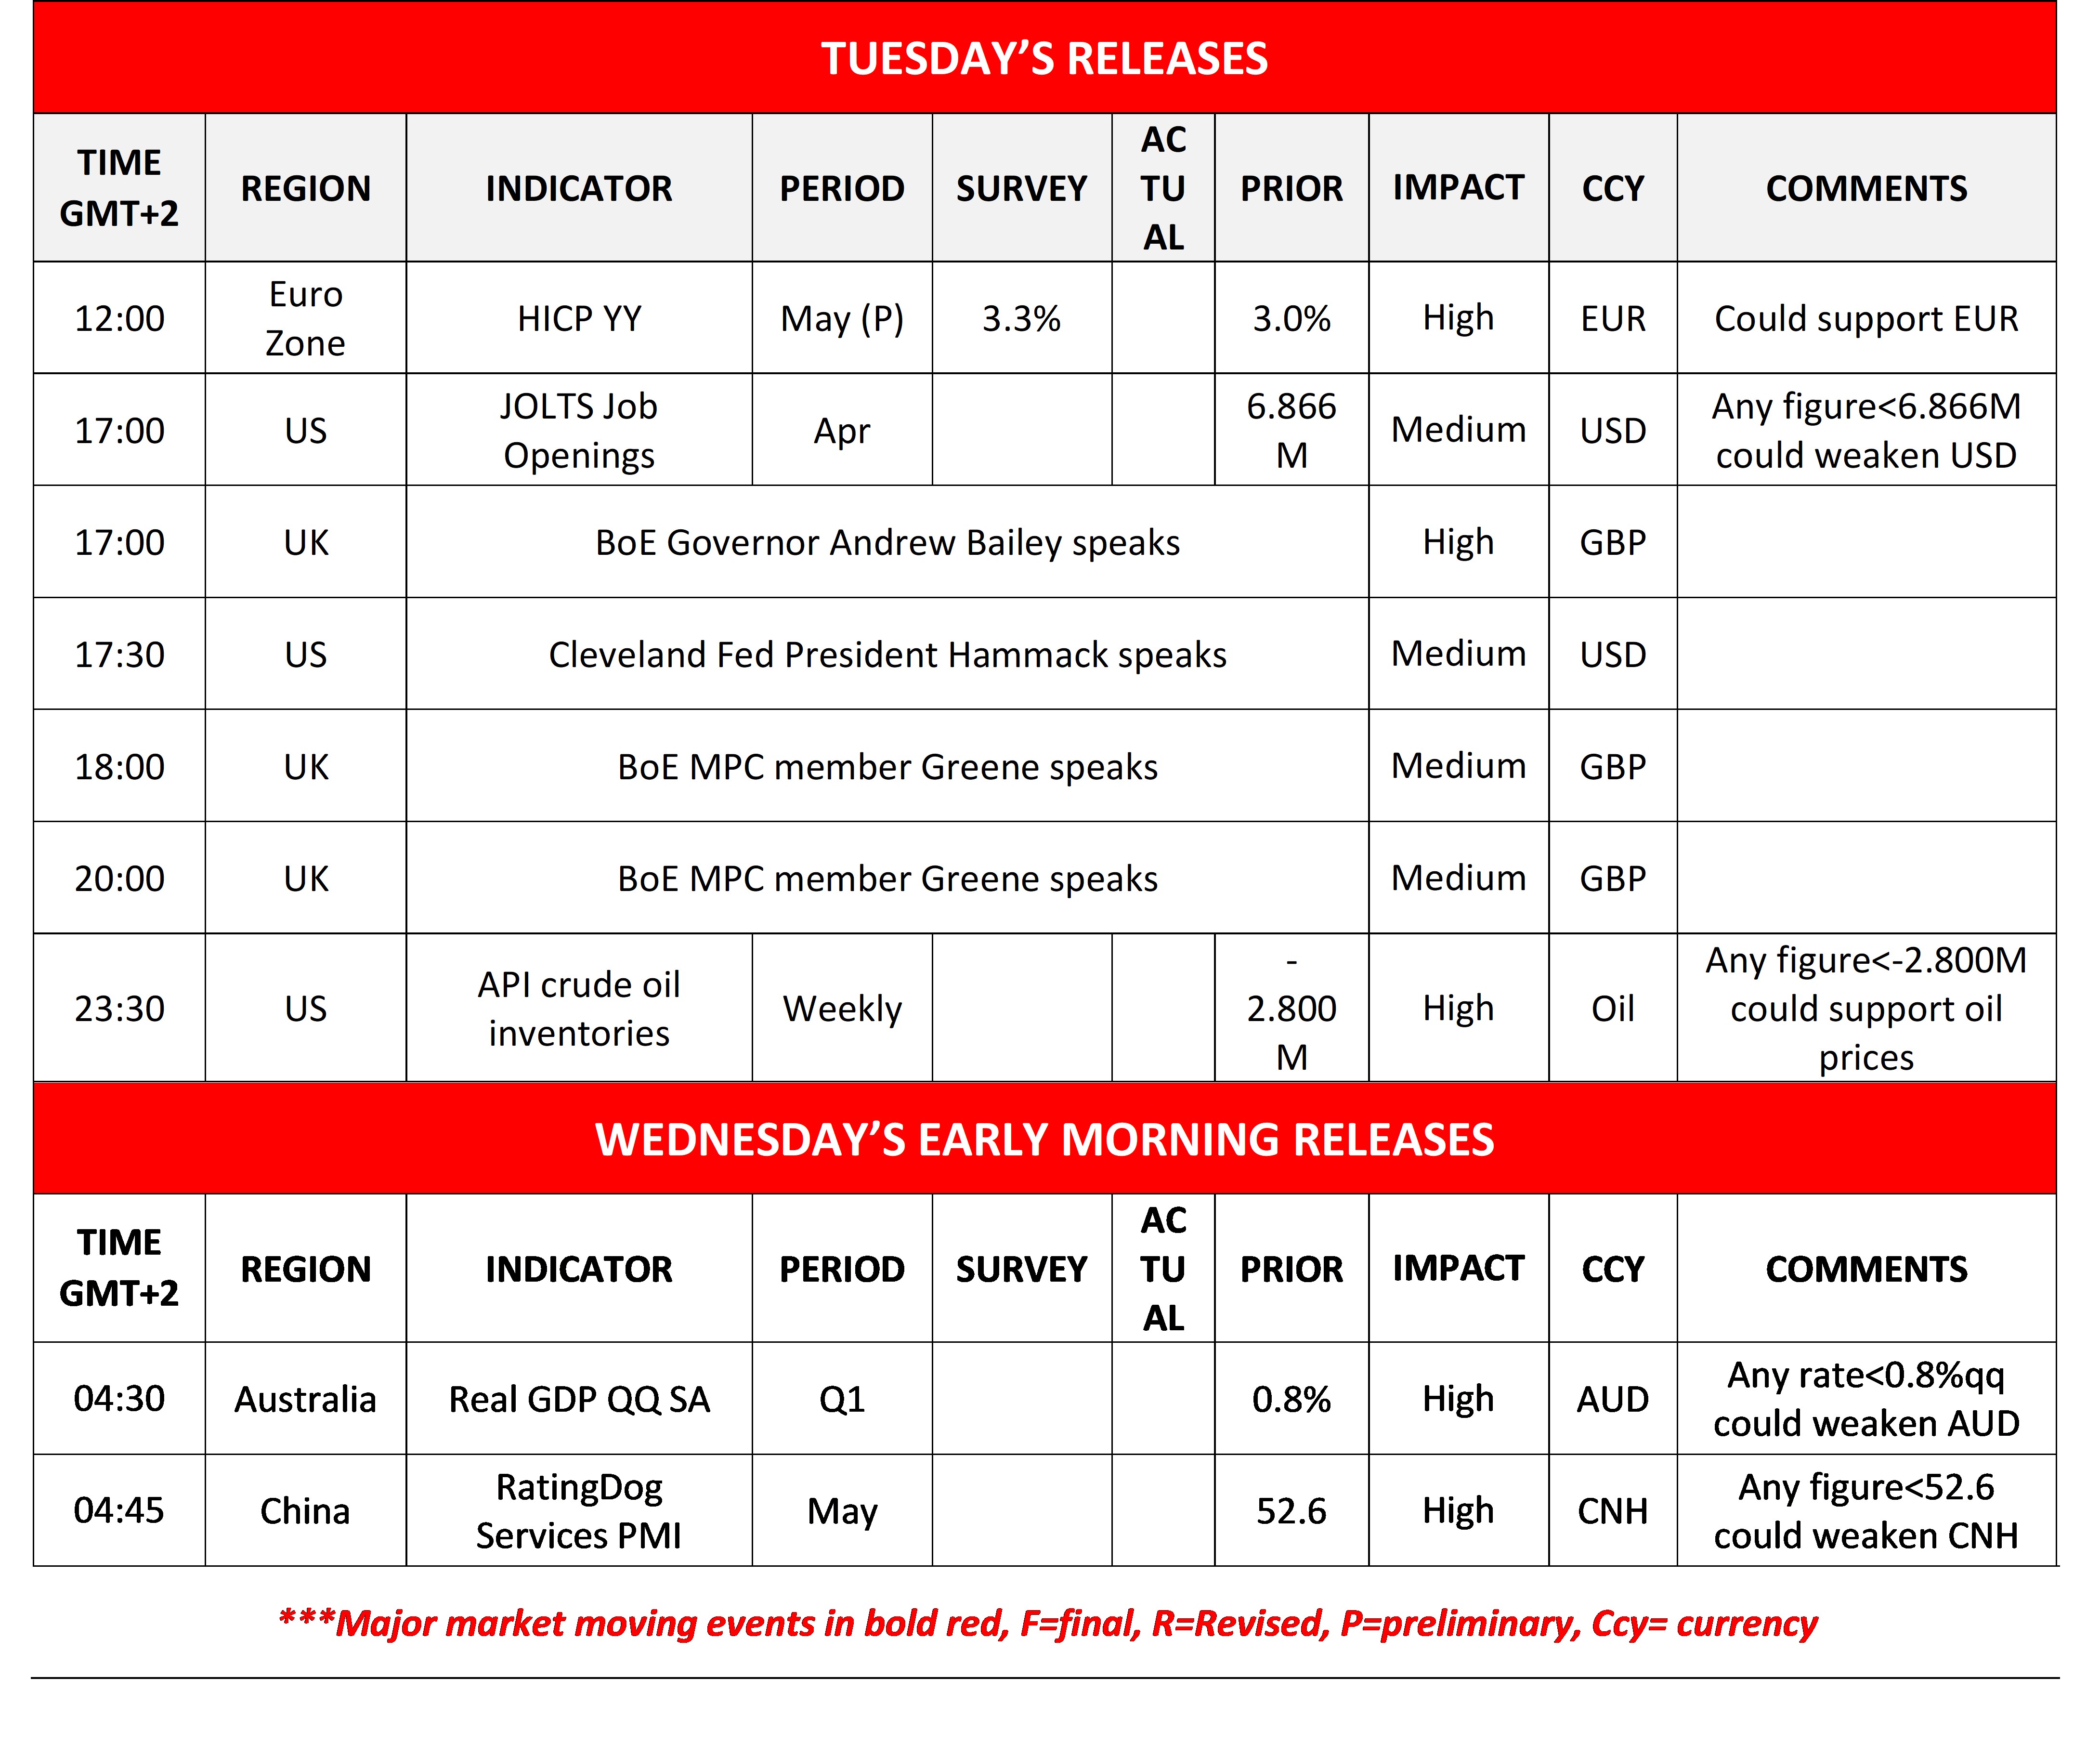
Otros destacados de hoy
Today we get the US JOLTS job openings figure for April and later on the US API crude oil inventories figure for the week. On a monetary level, we note that BoE Governor Andrew Bailey, BoE MPC member Greene and Cleveland Fed President Hammack speak. In tomorrow’s Asian session, we note the release of China’s Rating Dog services PMI figure for May.
Charts to keep an eye out
USD Index
The USD Index remained in a sideways motion over the past days, within the corridor formed by the 99.50 (R1) resistance line and the 98.85 (S1) support level. We intend to maintain a bias for a sideways motion of the index as long as its price action respects the prementioned levels. We also note that the RSI indicator runs along the reading of 50, which may allow the sideways motion to continue. Should the bulls get control over the pair, we may see the USD Index breaking the 99.50 (R1) resistance line and start aiming for the 100.10 (R2) resistance level. Should the bears take over, we may see USD Index breaking the 98.85 (S1) support line and set in its sights the 98.30 (S2) support level.
Nasdaq’s
Nasdaq’s continued to rise and is currently teasing the 30500 (R1) resistance line. We maintain a bullish outlook for index’s price action as long as it remains above the upward trendline guiding it. Yet we also note for a possible correction lower as the RSI indicator remains in overbought territory and the price action is nearing the upper Bollinger Band. Should the bulls remain in charge, we may see Nasdaq’s price breaking the 30500 (R1) resistance line and start aiming for the 31250 (R2) resistance level. Should the bears take over, we may see Nasdaq’s price action reversing the gains over the past ten days, breaking the 29675 (S1) support line and aim for the 29000 (S2) support level.
USD Index Daily Chart
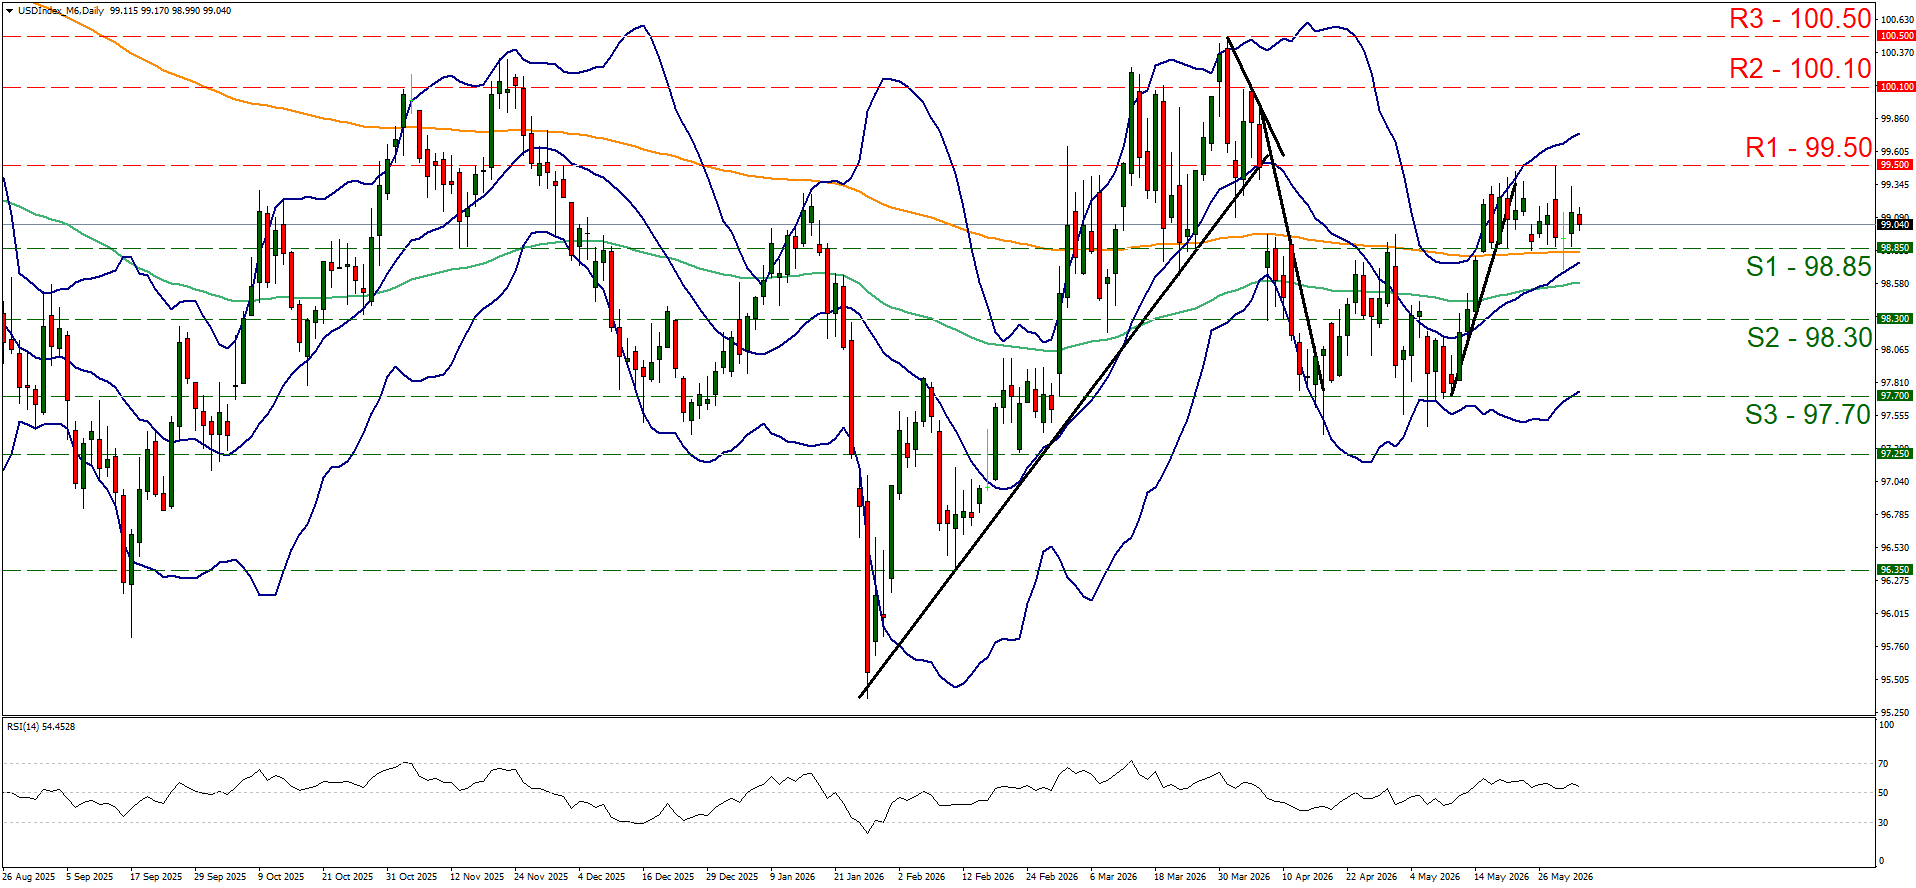
- Support: 98.85 (S1), 98.30 (S2), 97.70 (S3)
- Resistance: 99.50 (R1), 100.10 (R2), 100.50 (R3)
Nasdaq Gráfico Diario
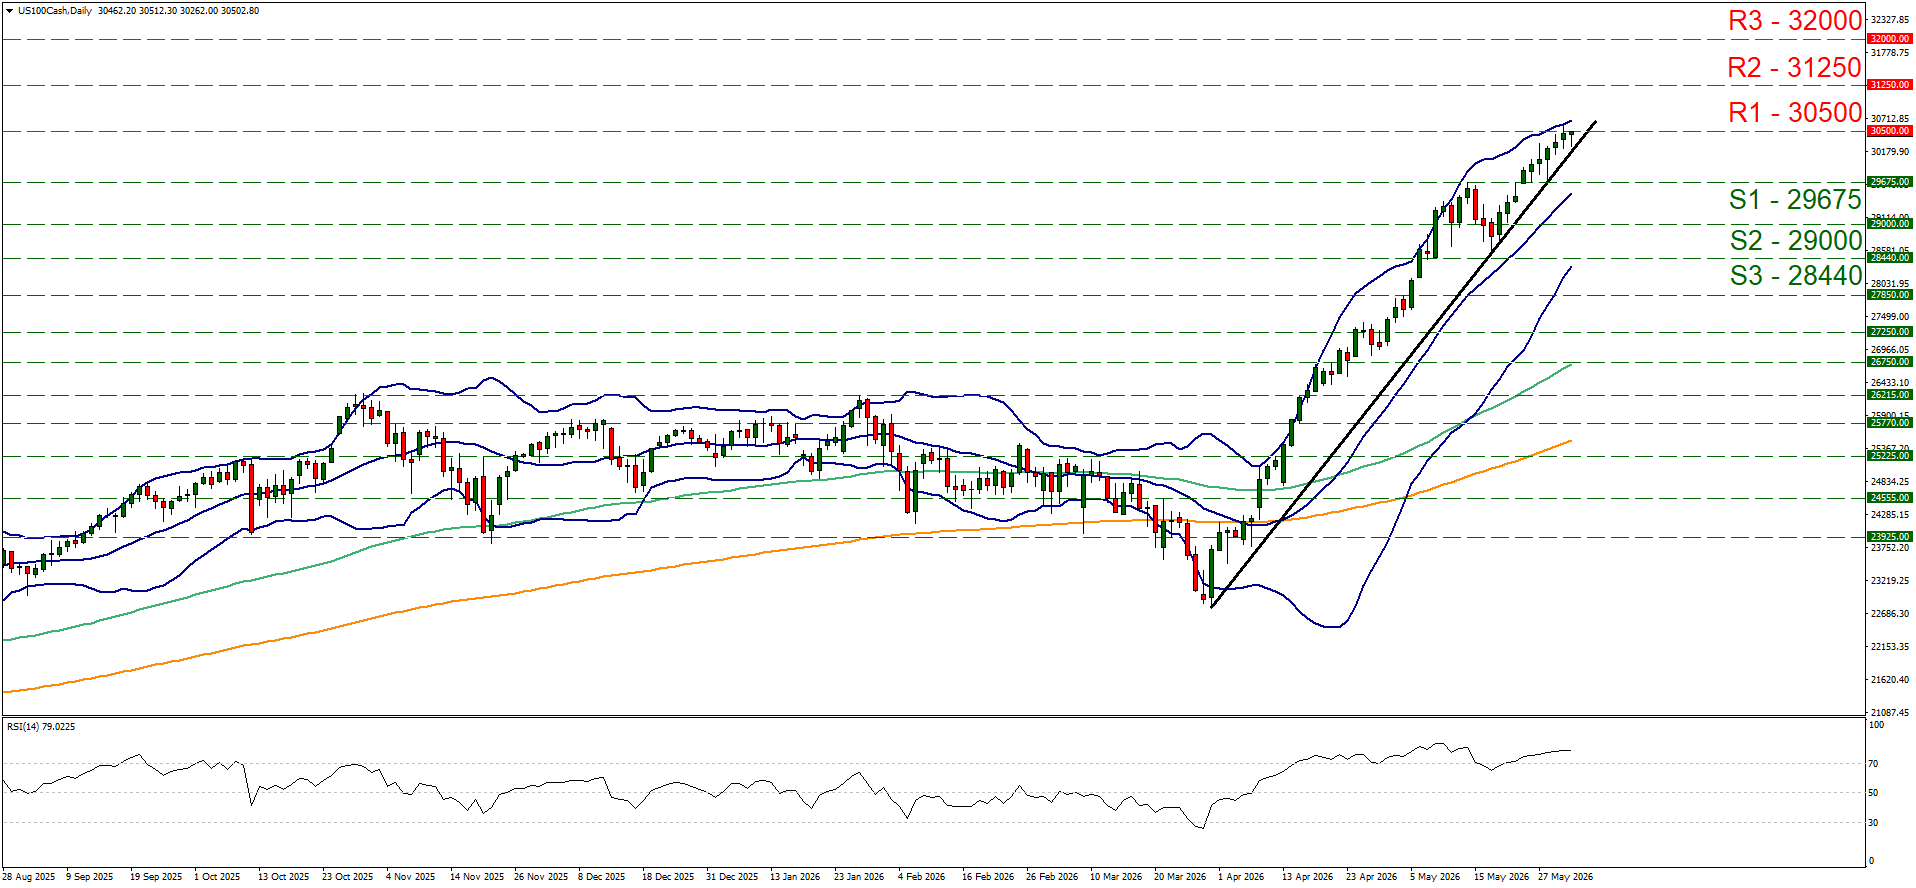
- Support: 29675 (S1), 29000 (S2), 28440 (S3)
- Resistance: 30500 (R1), 31250 (R2), 32000 (R3)
Descargo de responsabilidad:
Esta información no debe considerarse asesoramiento o recomendación sobre inversiones, sino una comunicación de marketing. IronFX no se hace responsable de datos o información de terceros en esta comunicación, ya sea por referencia o enlace.