EN
EN  FR
FR  ES
ES  JA
JA  KO
KO  PT
PT  ZH
ZH  AR
AR  FA
FA  RU
RU  NL
NL  MS
MS  VI
VI  PH
PH  TH
TH  ID
ID 


Since our last report Gold’s price, appears to be moving in a downwards trajectory. In today’s report we are to discuss mainly fundamental issues and we intend to end the report with a technical analysis of Gold’s daily chart.
US Employment data in sight
The US Employment data for August is set to be released this Friday. According to expectations by economists, the employment data is set to showcase a mixed employment picture. Specifically, the US Non-Farm payrolls figure for August is anticipated to showcase an improvement from -23k to 55k which could potentially provide support for the dollar. On the other, hand the unemployment rate is anticipated to remain at 4.1%, showcasing a lack of progress in reducing unemployment, whilst the average hourly earnings rate is expected to decline from 3.2% to 3.0%, which could further weigh on the dollar.
Overall, should Friday’s employment narrative point towards a resilient labour market, i.e a higher NFP figure or even a reduction in the unemployment rate it could increase pressure on the bank to hike rates in their September meeting. In turn, such a scenario could provide support for the dollar whilst weighing on gold’s price given their inverse relationship. Whereas should the data point towards a loosening labour market, it may reduce pressure for the Fed to hike rates in their next meeting, which may then weigh on the greenback, whilst aiding gold’s price given the aforementioned inverse relationship between the dollar and gold.
Fed Chair Warsh’s hawkish rhetoric
Fed Chair Warsh’s comments last Friday at the Jackson Hole Symposium appear to have been interpreted as hawkish in nature, with market expectations for a Fed rate hike in their September meeting moving higher. In particular, the Fed Chair stated that “while this summer’s [inflation] readings were better than expected, they do not tell me that underlying trends have meaningfully improved” and that “We must be confident that underlying inflation is moving to our objective, clearly and at sufficient speed. Otherwise, we have work to do. That’s our job, our mandate and our charge to keep”, showcasing the Fed Chair’s acknowledgment that should inflation remain persistent, the bank could opt for a tighter monetary policy path which could weigh on the precious metal’s price.
US-Iran tensions escalate once again The US and Iran have traded blows after American forces attacked two rocket launchers on Larak Island in the Strait of Hormuz. The strikes mark the first time US forces have attacked Iran since late July. Furthermore, Iran said it had struck US military bases in Jordan in response, with Jordan’s army saying it had intercepted eight missiles early on Monday morning. However, despite the resumption of hostilities the market’s appear unwavering as strikes between the US and Iran may be the new norm. However, should the situation escalate significantly, gold may see safe haven inflows which in turn could aid the precious metal’s price.
Technical Analysis
XAU/USD Daily Chart
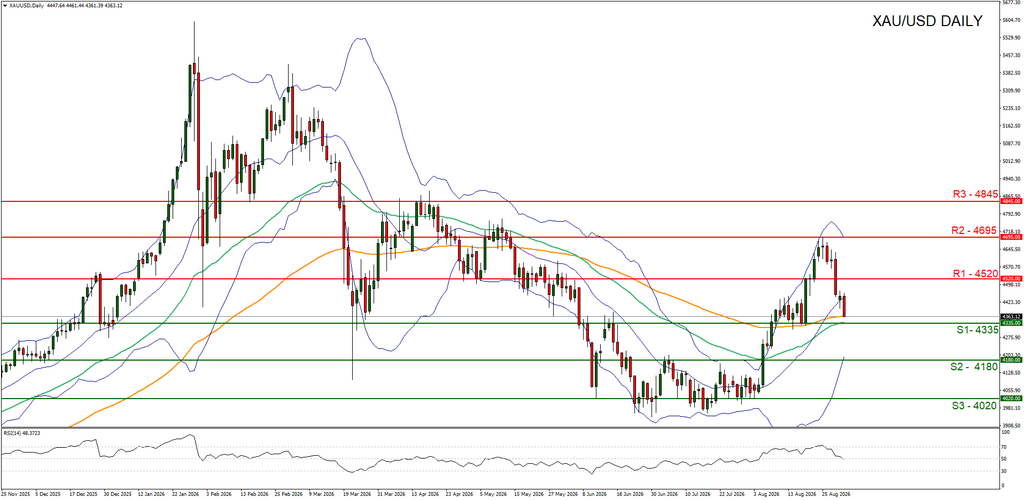
Resistance: 4520 (R1), 4695 (R2), 4845 (R3)
Gold’s price appears to be moving in a downwards trajectory, with the precious metal appearing to be aiming for our 4335 (S1) support level. We opt for a bearish outlook for the precious metal’s price and supporting our case is the RSI indicator below our chart which is currently registering a figure below 50 and considering the recent decline in the indicator, it may imply that the market sentiment may have shifted from favouring the bulls to the bears.
For our bearish outlook to be maintained we would require a break below our 4335 (S1) support level ,with the next possible target for the bears being our 4180 (S2) support line. On the other hand, for a sideways bias we would require gold’s price to remain confined between our 4335 (S1) support level and our 4520 (R1) resistance line. Lastly, for a bullish outlook we would require a clear break above our 4520 (R1) resistance line with the next possible target for the bulls being our 4695 (R2) resistance level.
Disclaimer:
This information is not considered investment advice or an investment recommendation, but instead a marketing communication. IronFX is not responsible for any data or information provided by third parties referenced or hyperlinked in this communication.