
Despite ongoing tensions between the US and Iran, global markets appear increasingly confident that diplomacy will prevent a prolonged energy disruption, as the market sees through the US-Iran crisis at the current stage.
This growing optimism is easing fears over supply risks, pushing oil prices lower while encouraging a broader shift toward risk-on positioning across major asset classes.
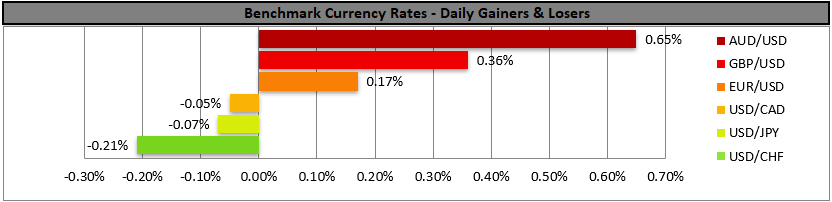
As sentiment improves, the USD continues to lose ground, US equities extend gains, and Bitcoin struggles to sustain its rebound amid still-muted demand.
USD continues to weaken
The USD continued to weaken against its counterparts as the market’s mood seemed to improve further and the USD’s safe-haven status weighed.
We still note though that on a monetary level signals from the Fed and the US Government seem to remain hawkish which may be providing some damage control for the greenback in the FX market. Yet the USD’s safe haven status remains the main catalyst behind its direction currently.
Oil prices continue to fall
The market’s expectations for a fresh round of negotiations between the US and Iran are still present and the market seems to continue to expect that a deal is to be reached, which tends to weigh on oil prices.
It should be noted, though that the US Navy has turned around sanctioned ships that were trying to exit the Straits of Hormuz. An enhancement of the market’s hopes for a US-Iranian deal could weigh on oil prices further.
US equities rise
US equities were on the rise yesterday as the market sentiment improved, allowing a more risk-on approach by the market. The tech sector once again seems to be the main beneficiary.
As for the earnings season, we note that market focus is expected to be on the release of Bank of America’s and Morgan Stanley’s reports in today’s premarket hours.
Bitcoin’s rally may be fizzling out
The strengthening of Bitcoin over the past two days seems to be fizzling out in today’s Asian session. We still remain cautious for the crypto’s upward direction amidst low demand.
We continue to note the crypto king’s weakness to clearly break the $76k mark and start signalling confidence in the crypto market.
Other highlights for today
Today we get France’s final HICP rates for March, Euro Zone’s industrial output for February, the US NY Fed Manufacturing index for April, Canada’s manufacturing sales for February and the weekly US EIA crude oil inventories figure.
On a monetary level, we note that Fed Board Governor Barr, BoE Governor Andrew Bailey, Fed Vice Chair Bowman, ECB Board Member Cipollone, ECB President Christine Lagarde, ECB Board Member Schnabel and RBA Deputy Governor Hauser are scheduled to speak. In tomorrow’s Asian session we note the release of the Australia’s employment data for March and China’s GDP rate for Q126.
Charts to keep an eye out
WTI’s
WTI’s price continued to be on the retreat yesterday breaking the 93.80 (R1) support line, now turned to resistance. The price action of WTI forces us to switch our sideways motion bias in favour of a bearish outlook in accordance with yesterday’s report.
We intend to maintain a bearish outlook as long as the downward trendline guiding it remains intact. Should the bears continue to lead WTI’s price action we may see it breaking the 87.10 (S1) support line which has allready been tested during today’s Asian session and continue lower, aiming for the 82.00 (S2) support level.
For a bullish outlook, which we consider currently as a remote scenario, we would require WTI’s price to reverse yesterday’s losses by breaking the 93.80 (R1) resistance line and continue to break also the 100.90 (R2) resistance level.
AUD/USD
AUD/USD edged higher yesterday and during today’s Asian session, testing the 0.7145 (R1) resistance level.
The RSI indicator is on the rise implying an intensifying bullish market sentiment for the pair. Should the bulls maintain control over the pair, we may see the pair breaking the 0.7145 (R1) resistance line and start aiming for the 0.7280 (R2) resistance level.
For a bearish outlook to emerge, AUD/USD’s price action has to break to reverse the gains made in the past week and break the 0.6940 (S1) support line and start aiming for the 0.6800 (S2) support base.

WTI Daily Chart
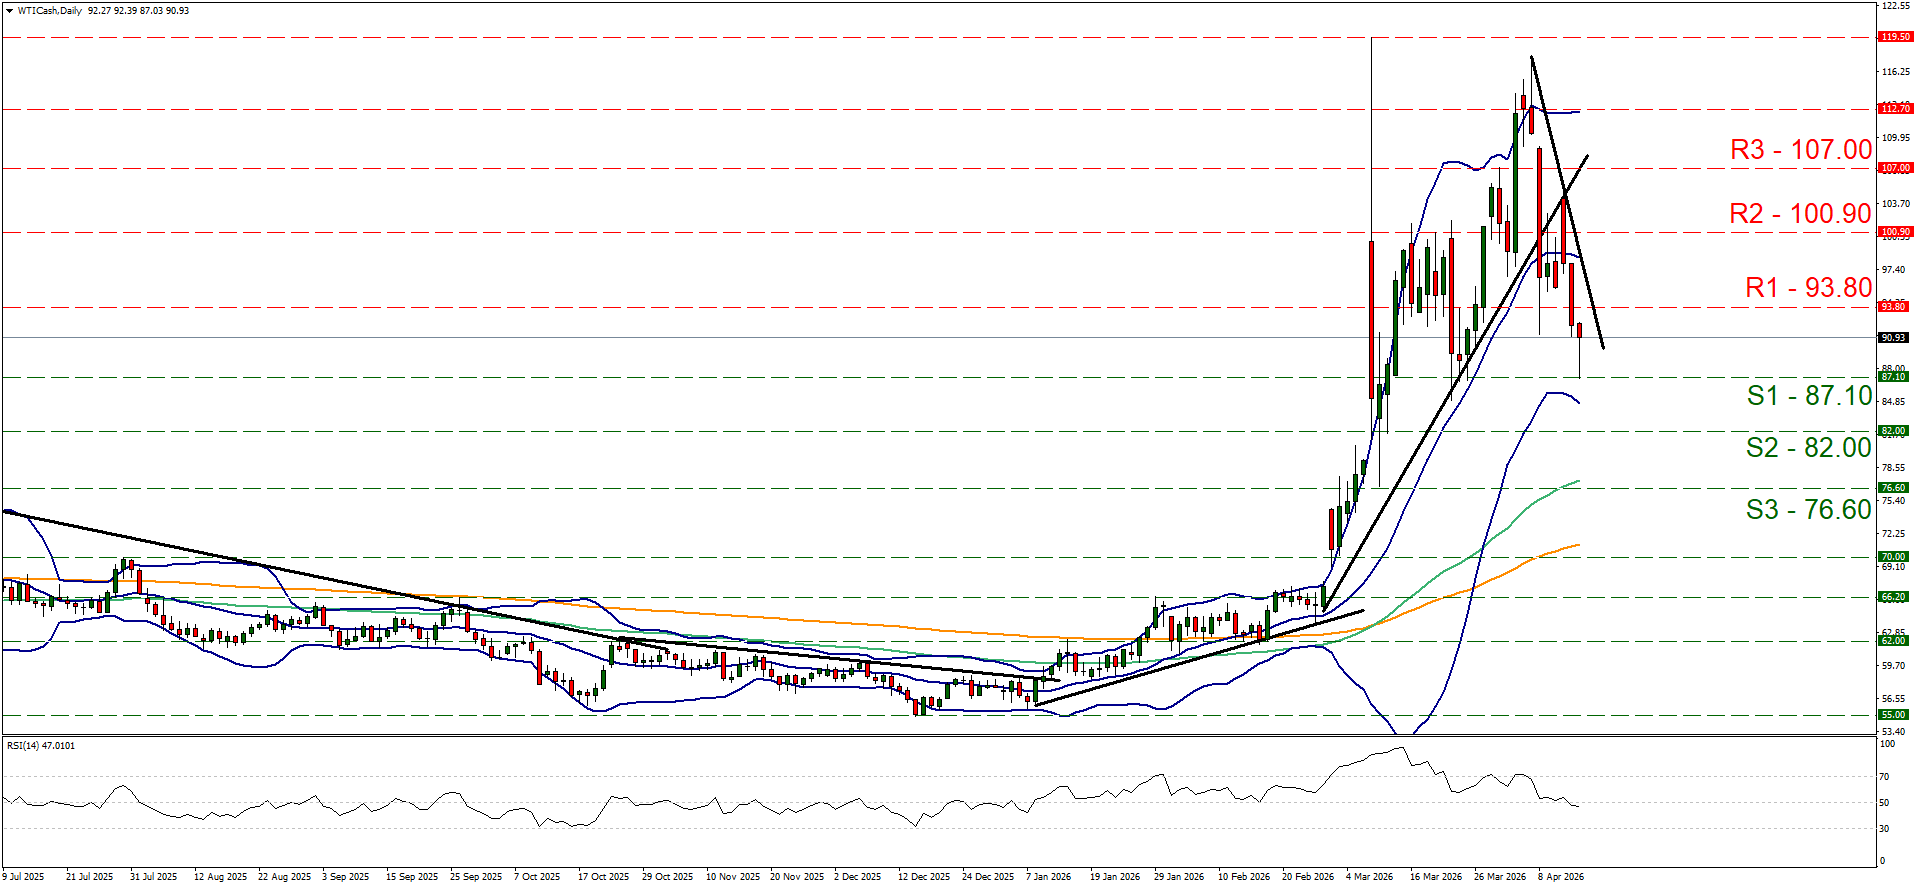
- Support: 87.10 (S1), 82.00 (S2), 76.60 (S3)
- Resistance: 93.80 (R1), 100.90 (R2), 107.00 (R3)
AUD/USD Daily Chart
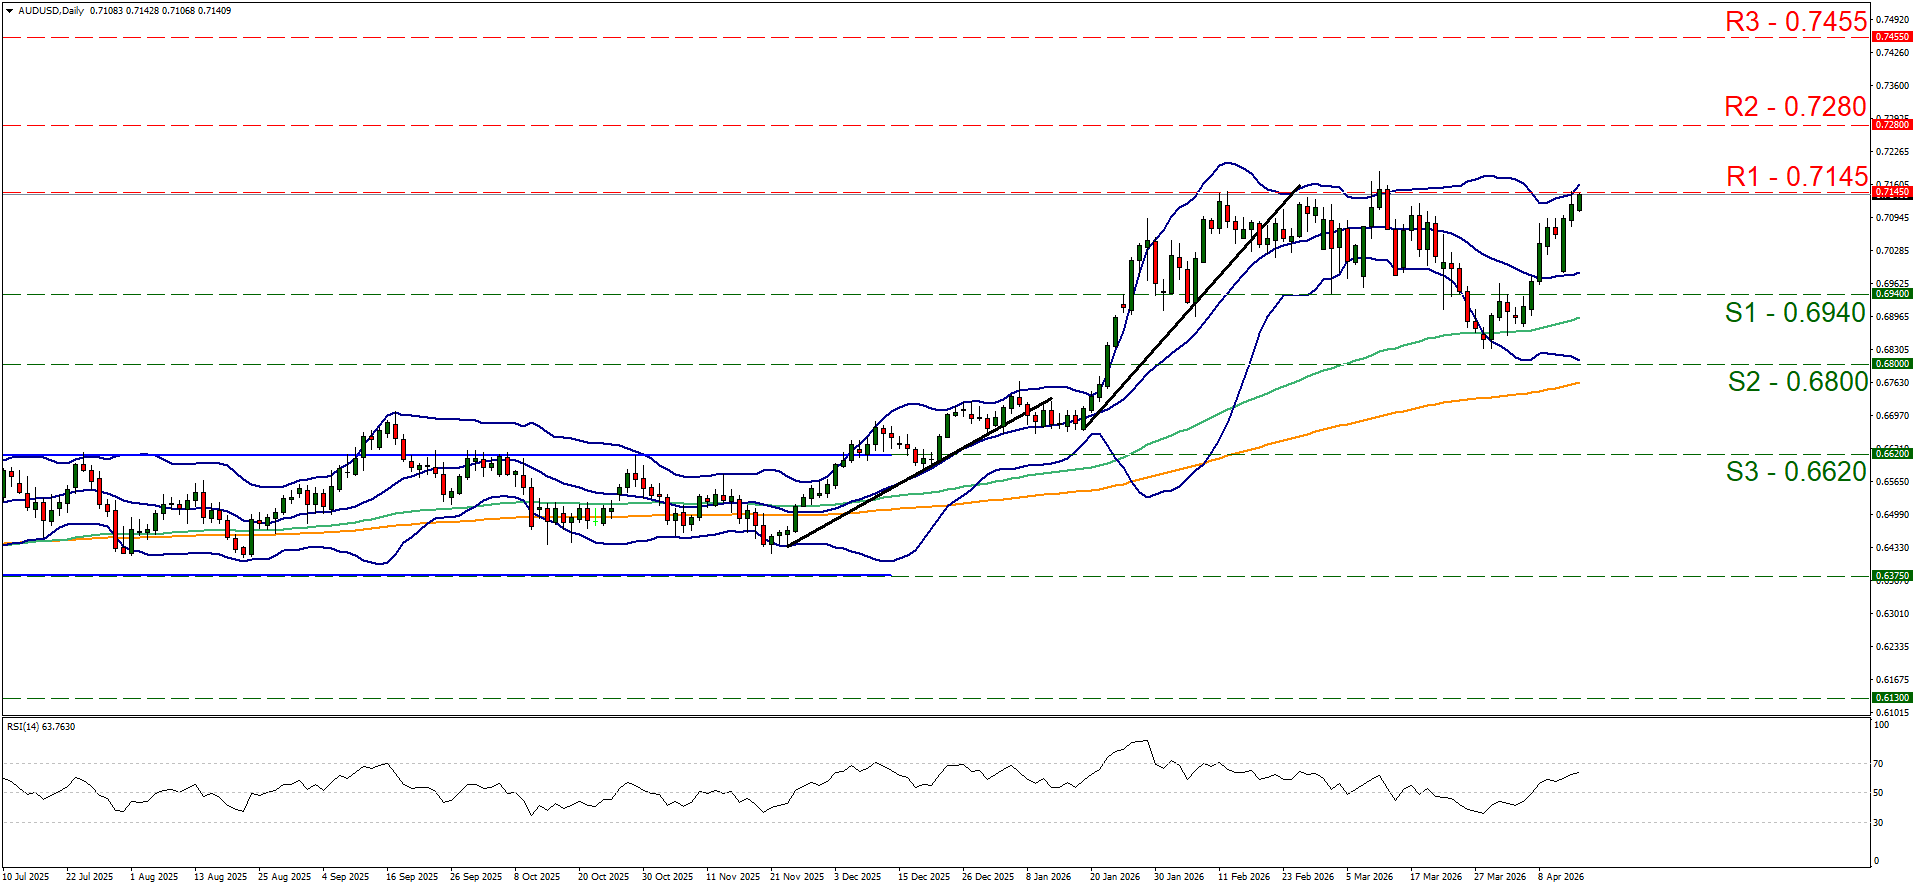
- Support: 0.6940 (S1), 0.6800 (S2), 0.6620 (S3)
- Resistance: 0.7145 (R1), 0.7280 (R2), 0.7455 (R3)
إخلاء المسؤولية:
لا تُعد هذه المعلومات نصيحة استثمارية أو توصية بالاستثمار، وإنما تُعد تواصلاً تسويقيًا. لا تتحمل IronFX أي مسؤولية عن أي بيانات أو معلومات مقدمة من أطراف ثالثة تم الإشارة إليها أو الارتباط بها في هذا التواصل.