
Peace deal on the horizon? Oil prices may face renewed downside pressure as optimism grows around a possible US-Iran agreement and the reopening of the Straits of Hormuz.
Meanwhile, the USD remains under pressure amid improving risk sentiment, US equities hover near record highs, and gold stays steady as markets await fresh central bank signals.
Prospects for talks may weigh on oil prices
Oil prices edged higher during today’s Asian session. We still see the case for some bearish tendencies on a fundamental level, as the prospects for a US-Iranian peace deal and subsequently an opening of the Straits of Hormuz seem to grow.
We may have further progress during the weekend on the negotiations and if so, we may see oil prices losing ground.
On the flip side should the two sides fail to make progress and market worries start growing again, we may see oil prices gaining some ground.
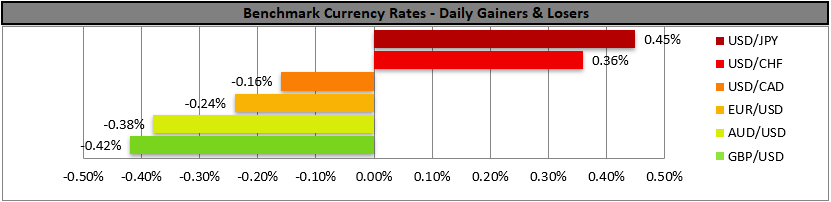
Low volatility in the FX market
The FX market is experiencing low volatility and the USD is about to end a second week in the reds as its safe haven status tends to weigh, given the improvement of the market mood. We tend to maintain some worries for the GBP as pressure on UK PM Starmer to resign is mounting and political instability may rise in the UK. On the other hand, market expectations for the ECB to hike rates may support the EUR.
US stock markets prepare to end the week at record high levels
US equities seem to remain confident as the week draws to a close given that major US stock market indexes remained at record high levels.
We also note that Netflix’s earnings report may have disappointed traders, as despite beating market expectations for the EPS and revenue figures of Q126, its forward guidance for Q226 is weak and Chairman and Co-founder Hastings is stepping down after twenty years.
Gold’s price remains steady
Gold prices remained relatively stable yesterday and in today’s Asian session, maybe with some mild gains for the week. We still see as a major factor behind gold’s price the Fed’s intentions and the direction of the USD.
Signals for a possible tightening of the Fed’s monetary policy could weigh on gold’s price and vice versa, yet the market interest for the precious metal remains tepid.
Other highlights for today
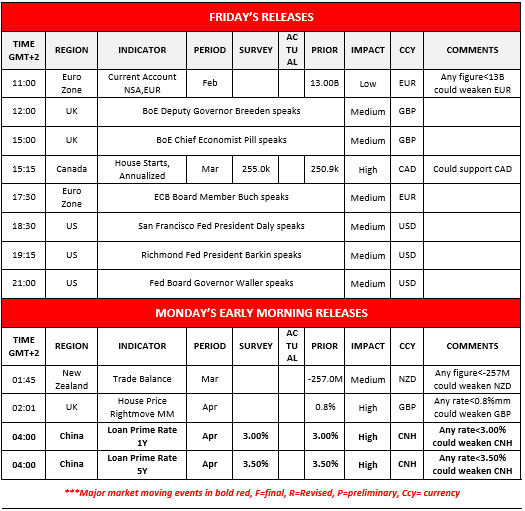
In an easy-going Friday, we note the release of Euro Zone’s current account balance for February and from Canada we get the number of House starts for March.
On a monetary level, we note that BoE’s Breeden and Pill, ECB’s Buch and the Fed’s Daly, Barkin and Waller are scheduled to speak.
During Monday’s Asian session, we note the release of New Zealand’s trade data for March, UK’s House prices by Rightmove for April and from China PBoC’s interest rate decision.
Charts to keep an eye out
WTI
WTI’s price edged a tat bit higher in today’s Asian session, after yesterday’s gains, remaining near the 93.80 (R1) resistance line.
The RSI indicator remained near the reading of 50, implying a rather indecisive market, and the downward trendline guiding WTI’s price action since the 7th of April is put to the test today, suggesting a make or break position of WTI’s price action.
Should WTI’s price action follow the downward trendline’s command we would maintain our bearish outlook and expect WTI’s price to near if not breach the 87.10 (S1) support line.
Should the bulls take over we may see WTI’s price breaking the prementioned downward trendline, the 93.80 (R1) resistance line and start aiming for the 100.90 (R2) resistance level.
USD/CAD
USD/CAD continued to weaken yesterday and during today’s Asian session, breaking clearly the 1.3720 (R1) support line, now turned to resistance. We maintain a bearish outlook for the pair, given also that the RSI indicator is nearing the reading of 30.
Should the bears maintain control as expected, we set as the next possible target for USD/CAD bears the 1.3520 (S1) support line.
Should the bulls take over we may see USD/CAD reversing direction, breaking the prementioned downward trendline, the 1.3720 (R1) resistance line and start aiming for the 1.3880 (R2) resistance base.
WTI Daily Chart
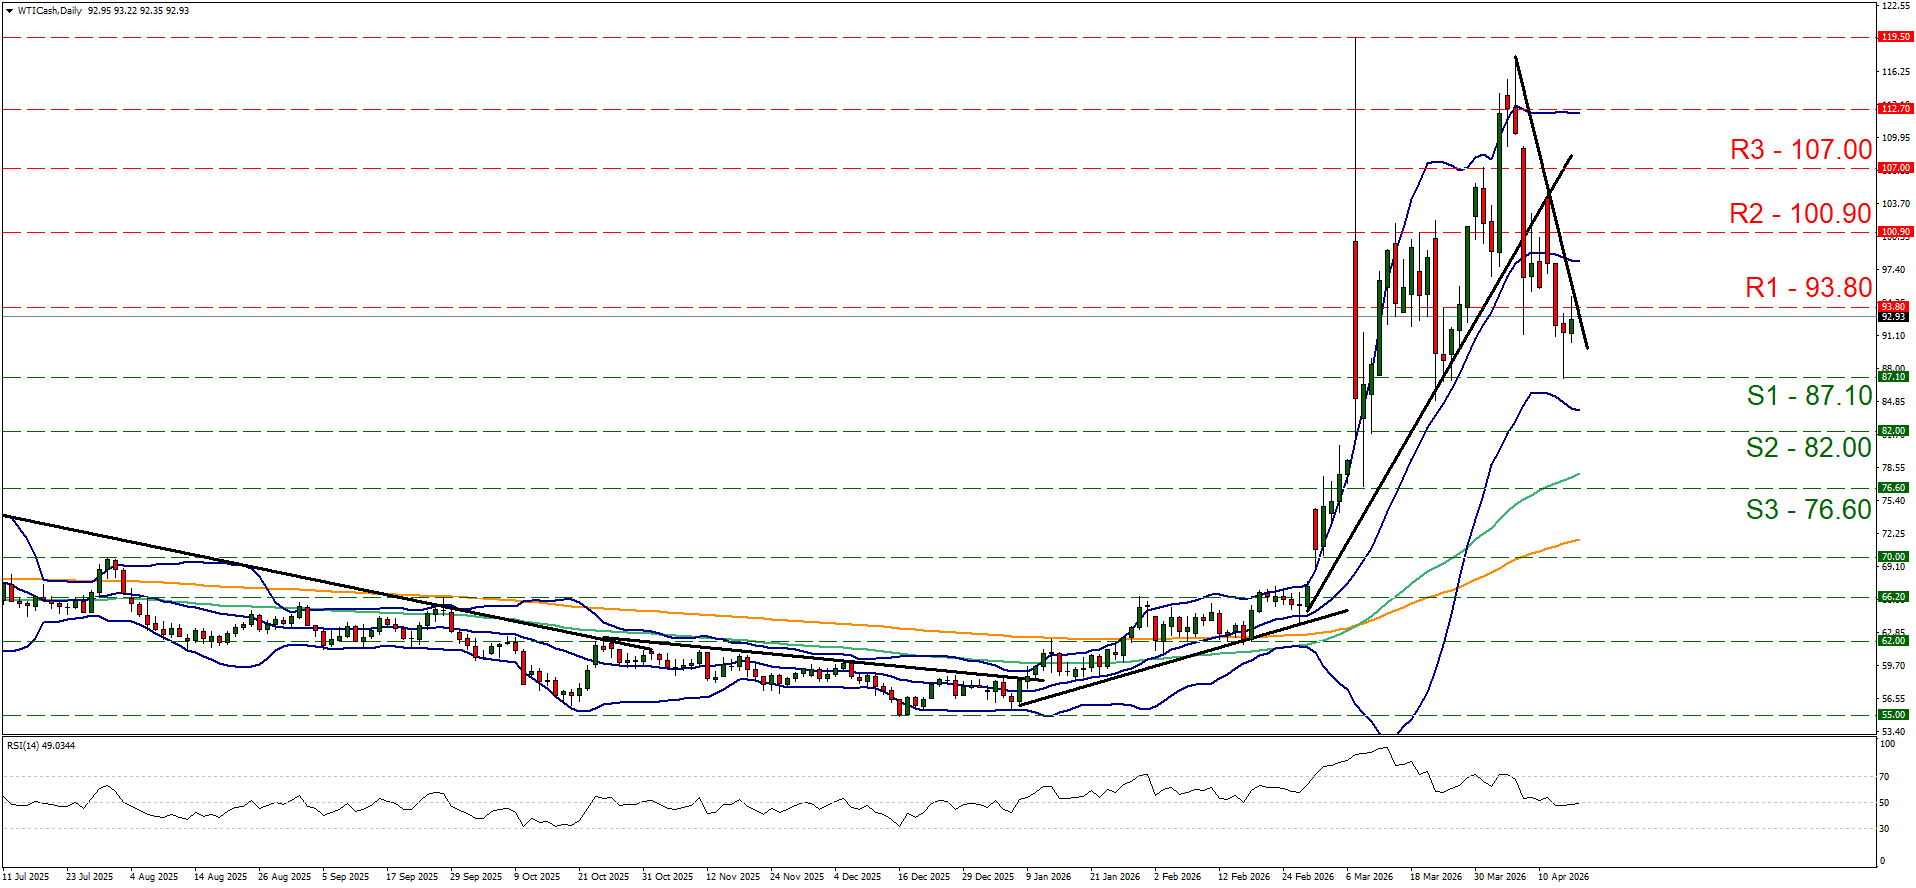
- Support: 87.10 (S1), 82.00 (S2), 76.60 (S3)
- Resistance: 93.80 (R1), 100.90 (R2), 107.00 (R3)
USD/CAD Daily Chart
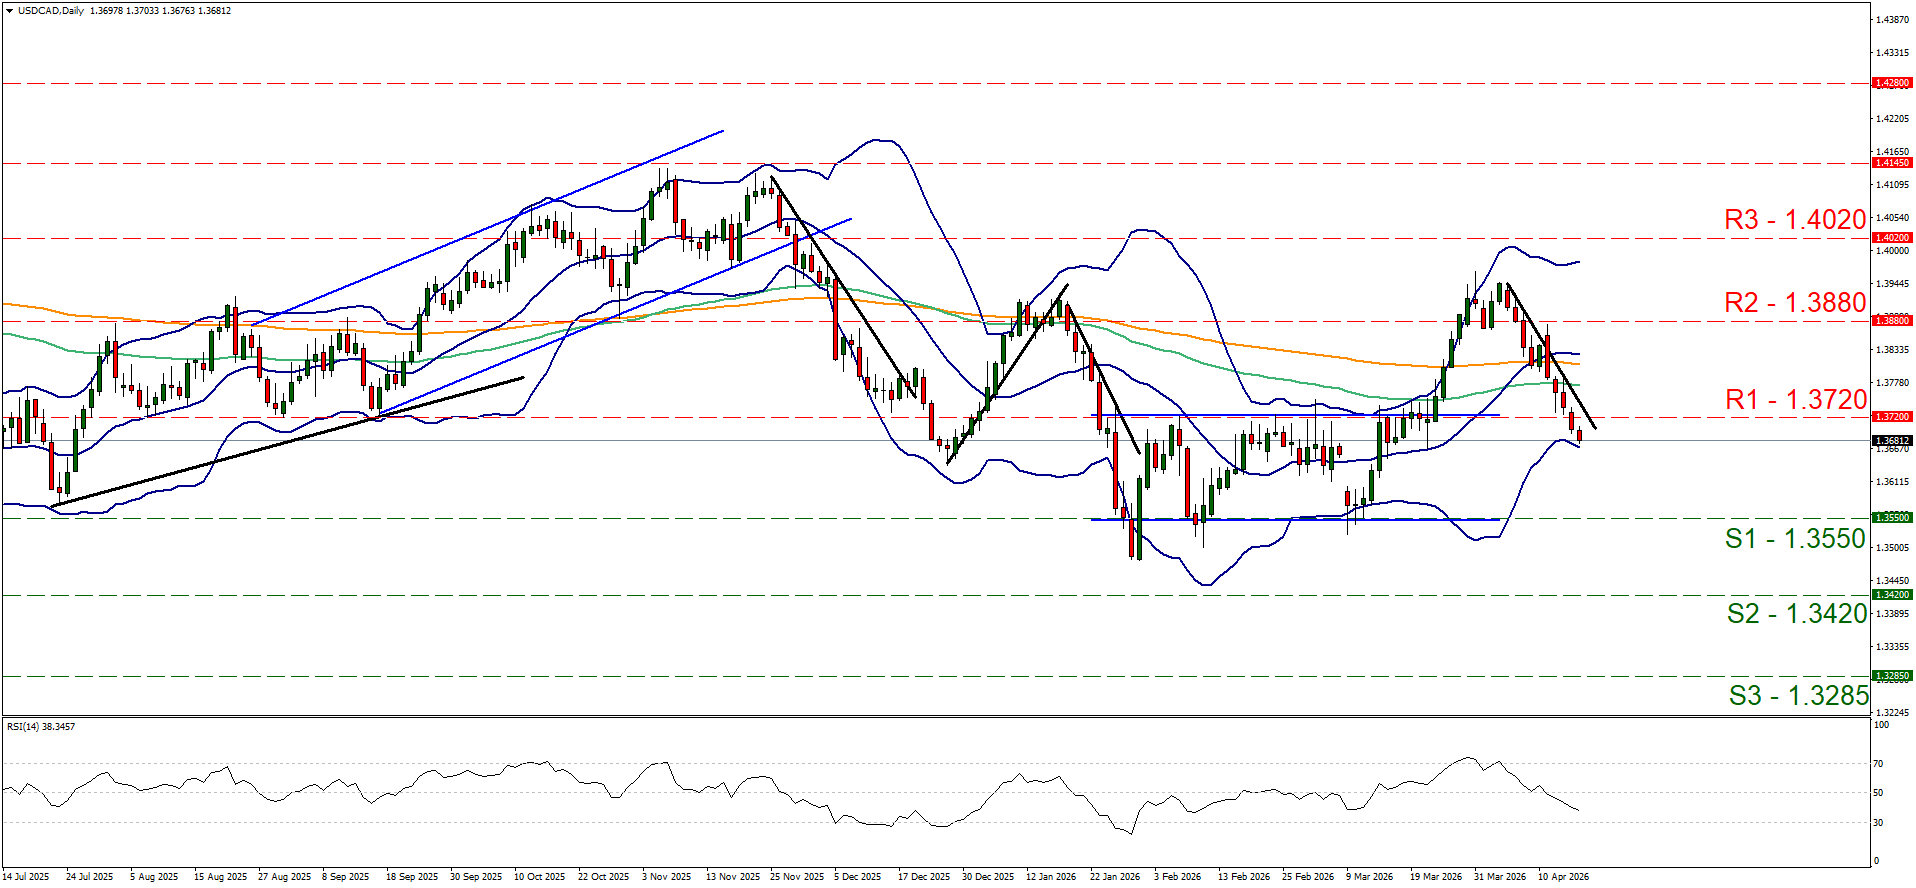
- Support: 1.3550 (S1), 1.3420 (S2), 1.3285 (S3)
- Resistance: 1.3720 (R1), 1.3880 (R2), 1.4020 (R3)
إخلاء المسؤولية:
لا تُعد هذه المعلومات نصيحة استثمارية أو توصية بالاستثمار، وإنما تُعد تواصلاً تسويقيًا. لا تتحمل IronFX أي مسؤولية عن أي بيانات أو معلومات مقدمة من أطراف ثالثة تم الإشارة إليها أو الارتباط بها في هذا التواصل.