
Since our last report, WTI’s price has risen slightly and returned to the same levels. In today’s report we are to discuss the latest developments on a fundamental level, surrounding WTI’s price like the recent US intervention in Venezuela, the possibility of new US sanctions on Russian oil and the state of the US oil market.
The report is to be concluded with a technical analysis of WTI’s daily chart.
US intervenes in Venezuela
On Saturday, US President Trump announced that the US has arrested Venezuelan President Maduro and his wife in Caracas. The Venezuelan President was extracted and transferred to the US, where he is to face charges including narco-terrorism conspiracy and cocaine importation conspiracy in a superseding indictment.
The extraction of Maduro by US forces created a power vacuum in Venezuela, which seems to be covered by Venezuela’s Vice President Delcy Rodriguez, now sworn in as Venezuela’s Interim President. The Venezuelan Interim President seems to be approved also by the US, in a surprise move. We have to note that Rodriquez despite issuing harsh statements for the US intervention at the beginning, seems to have now moderated her stance which may allow for some corridors of a new modus vivendi to emerge.
US President Trump has since repeatedly stated that the US will be supervising Venezuela and profit from oil extraction, characteristically stating that the US will be controlling Venezuela’s oil for years. The issue is in direct contempt of the rule of international law, yet that is for the oil market is of little consequence at the current stage.
We have no doubt that the US may be planning to flood the market with Venezuelan oil, as the country has the largest oil deposit world-wide and presumably US sanctions of exports of Venezuelan oil are to be lifted, now that US companies are to take over. Such intentions could weigh on oil prices as the supply side of the commodity’s market will hike production levels.
Yet such a hike may take time as US sanctions are still in place, and the oil industry infrastructure in Venezuela may need considerable expansion to accommodate the higher oil production levels. Should we see indications of increased production in the short term, such as a lift of US sanctions, we expect oil prices to lose ground, while difficulties in increasing oil production in Venezuela, may support oil prices.
More sanctions on Russian oil
On the other hand, the US President seems to be intensifying the pressure on Russia to end the war in Ukraine, by allowing the Russia sanctions bill to advance. It should be noted that Republican Senator Lindsey was reported by Reuters to have stated that US President Trump has given the green light to proceed with legislation, with the relevant voting occurring possibly as early as next week. The issue intensified market worries for a possible further tightening of the supply side of the international oil market which tends in turn to provide support for oil prices.
US oil market unexpectedly tightens
We note that over the past week oil market related data from the US highlighted an unexpected tightening of the US oil market. Characteristically, API on Tuesday reported a drawdown in US crude oil inventories of -2.8 million barrels, thus implying that aggregated oil demand in the US surpassed oil production levels.
The drawdown reported by API was unexpected as initially another, narrower increase of US oil reserves was expected. The picture of a tightening US oil market was further enhanced on Wednesday as the Energy Information Administration’s (EIA) Crude Oil Inventories figure also unexpectedly, showed a drawdown of -3.832 million barrels.
Should we see further tightening of the US oil market, in the coming week, we may see oil prices getting some support. On the other hand we have to note the decline in economic activity of the US manufacturing sector, as reported by the ISM manufacturing PMI figure for December and the US factory orders growth rate for November, which may be warning for a possible easing on the demand side of the US oil market.
Oil Technical Analysis
WTI Cash Daily Chart
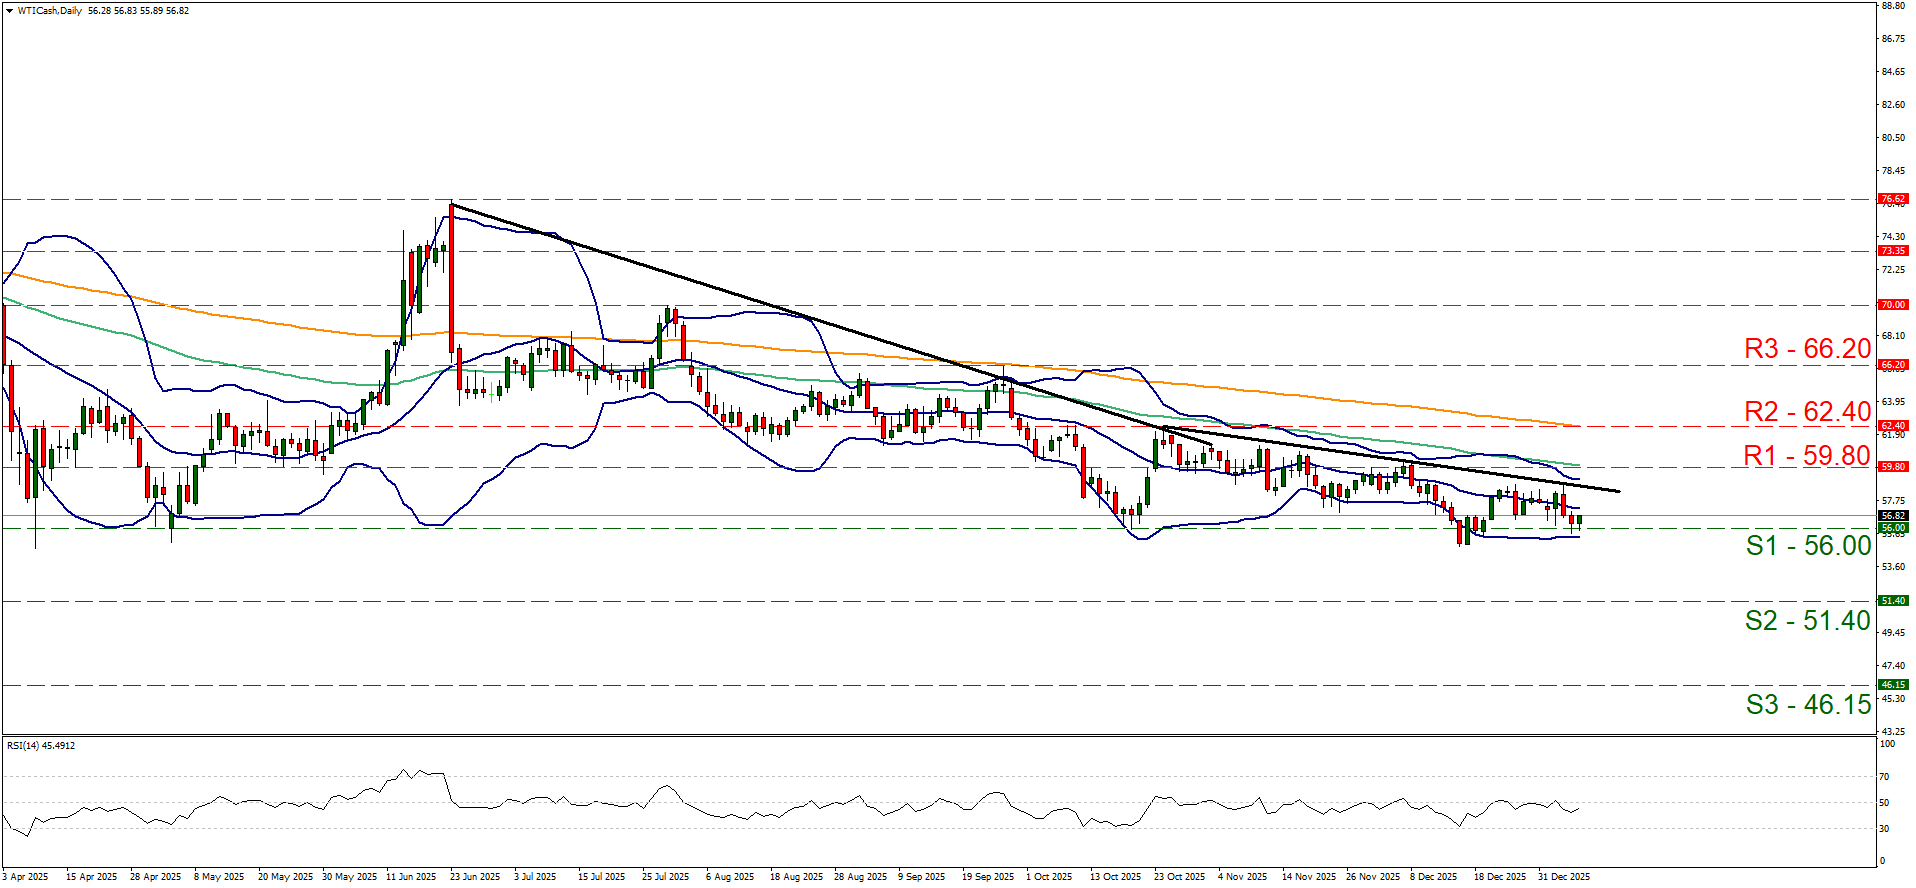
- Support: 56.00 (S1), 51.40 (S2), 46.15 (S3)
- Resistance: 59.80 (R1), 62.40 (R2), 66.20 (R3)
Despite some subtle bearish tendencies for WTI’s price, over the past two days, the commodity’s price action has remained well within the boundaries set by the 59.80 (S1) support line and the 59.80 (R1) resistance level. It should be noted though that WTI’s price is currently testing the 56.00 (S1) support line.
We note the downward trendline active since the 24 of October, yet at the same time we note the failure of the commodity’s price action to form lower troughs. For the time being we tend to maintain a bias for a sideways motion to be maintained, at least as long as the S1 and the R1 remain intact. The RSI indicator remains below but close to the reading of 50, implying a rather indecisive market sentiment for the direction of the commodity’s price action.
Also the Bollinger bands seem to be narrowing, which may imply lower volatility for WTI’s price which in turn may allow the sideways motion to continue. For a bearish outlook to emerge on a technical level, we would require WTI’s price to break clearly the 56.00 (S1) support line and continue lower aiming if not breaching the 51.40 (S2) support level. For a bullish outlook to emerge, we would require WTI’s price to break the 59.80 (R1) resistance line and continue higher aiming if not breaching the 62.40 (R2) resistance base.
免责声明:
This information is not considered investment advice or an investment recommendation, but instead a marketing communication. IronFX is not responsible for any data or information provided by third parties referenced or hyperlinked in this communication.