US equities moved higher since our last report. In today’s report we are to have a look at the recent release of the US CPI rates and JPM’s earnings.We are to conclude the report with a technical analysis of S&P 500’s daily chart.
US CPI rates tend to disappoint
The US CPI rates for December were released yesterday and tended to disappoint US Equity short sellers as the anticipated acceleration on a core level did not materialize. In the turn the inflation data may have provided some support for the US Equities markets as the need for the Fed to adopt a more hawkish stance may have eroded somewhat. For today we would like to note the release of the US PPI rates for November later today. December’s CPI rates remained unchanged providing little insight for inflationary pressures in the US economy. Should we see the PPI rates accelerating, that could provide some support for the USD as could a possible acceleration of the retail sales growth rate which would imply a strengthening of the demand side in the US economy.
JPM earnings report spooks some market participants
JP Morgan and Chase released their earnings report for Q4 2025 earlier on today. In their earnings report, JPMorgan (#JPM) noted that revenue increased 7% to $45.8 billion thanks to higher profits on lending. The figure was still below Wall Street’s estimates of $46.2 billion. However, what appears to have spooked investors may have been the 7% profit decline and the reduction in investment banking fees, which could imply that dealmaking could be loosing some steam. In turn the release may have weighed on JPMorgan’s stock price and in turn could have aided the decline of the US Equities markets.
Phân tích kỹ thuật
US500 Daily Chart
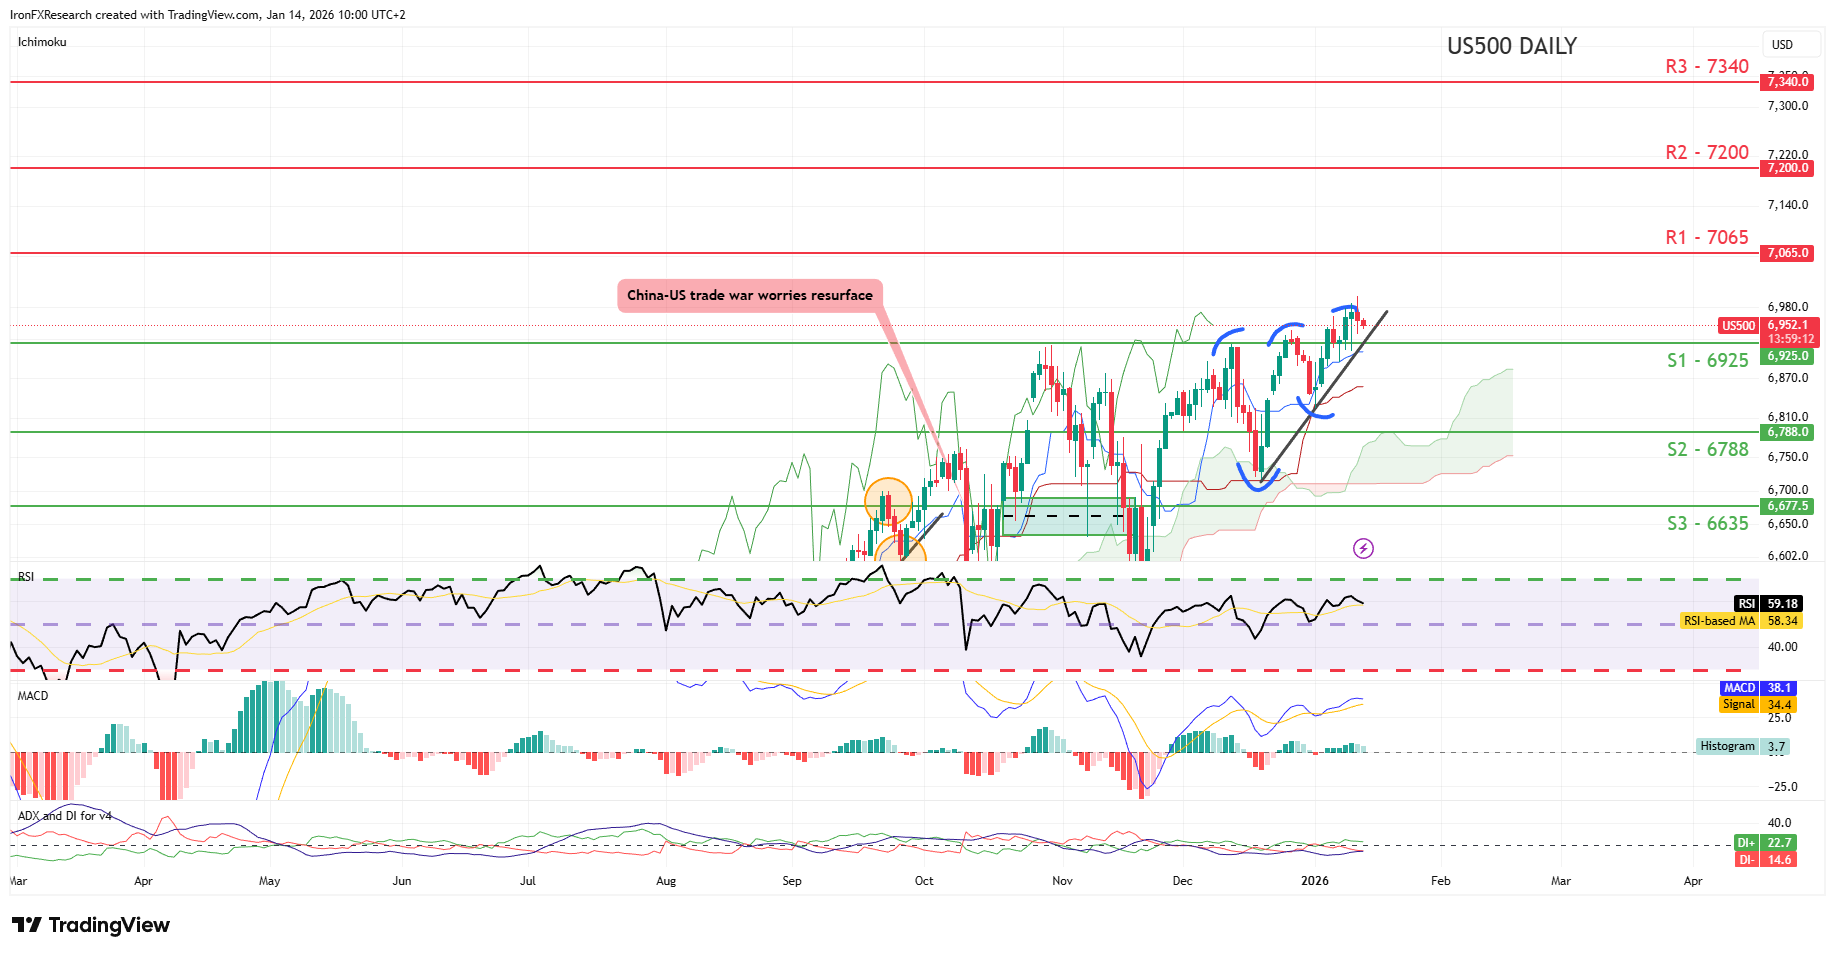
• Support: 6925 (S1), 6788 (S2), 6635 (S3)
• Resistance: 7065 (R1), 7200 (R2), 7340 (R3)
US500 appears to be moving in an upwards fashion. We opt for a bullish outlook for the index and supporting our case is our upwards moving trendline located on the chart in addition to the RSI , MACD and ADX with DI indicators below our chart which tend to imply a bullish market sentiment. For our bullish outlook to be maintained we would require the index to remain above our 6925 (S1) support level with the next possible target for the bulls being our hypothetical 7065 (R1) resistance line. On the other hand, for a bearish outlook we would require a clear break below our 6925 (S1) support level with the next possible target for the bears being our 6788 (S2) support line. Lastly, for a sideways bias we would require the index to remain confined between our 6925 (S1) support line and our 7065 (R1) resistance level.
If you have any general queries or comments relating to this article please send an email directly to our Research team at research_team@ironfx.com
Disclaimer:
This information is not considered as investment advice or an investment recommendation, but instead a marketing communication. IronFX is not responsible for any data or information provided by third parties referenced, or hyperlinked, in this communication.