Gold’s price continued to rise since our last report with the next target possible being gold’s ATH figure.
In today’s report we are to discuss fundamental issues affecting gold’s price such as the market’s expectations for the current situation in Venezuela and the upcoming release of the US Employment data.
We are also adding a technical analysis of gold’s daily chart at the end of the report for a rounder view.
US military shows its teeth as it snatches Maduro
Well, it finally happened, the US administration got rid of Venezuelan President Maduro in a spectacular fashion over the weekend, in what can be described as a textbook military operation which involved the capture of Maduro and his spouse by American special forces.
The forcible removal of Maduro showcases to the region and to the world that the US is still here and is willing to act in order to promote their interests. In turn the actions by the US Government had resulted in a power vacuum in the region and appear to have raised some concern as to whether the US may have other targets in their sights.
Overall, the possibility of a military escalation between Venezuela and the US is at all time highs considering they have literally kidnapped their President and thus as tensions continue to rise, gold’s price may have benefited considering its safe haven asset status.
US Employment data due out Friday
The US Employment data for December is set to be released on Friday. The current expectations by economists are anticipating the financial release to showcase a mixed labour market. Specifically, the NFP figure is expected to come in at 55k which would be lower than the prior figure of 64k, thus implying a loosening labour market.
Yet, the unemployment rate is expected to decrease from 4.6% to 4.5%, effectively contradicting the implications of a loosening labour market. In turn, should the data point towards a resilient labour market, the need for the Fed to continue on their rate cutting path may diminish which may hence aid the greenback, whilst weighing on gold’s price given their inverse relationship.
On the other hand, should the employment data showcase a loosening labour market, it may have the opposite effect as calls for the Fed to cut rates in the near future may increase, hence potentially aiding gold’s price.
Gold Technical Analysis
XAU/USD Daily Chart
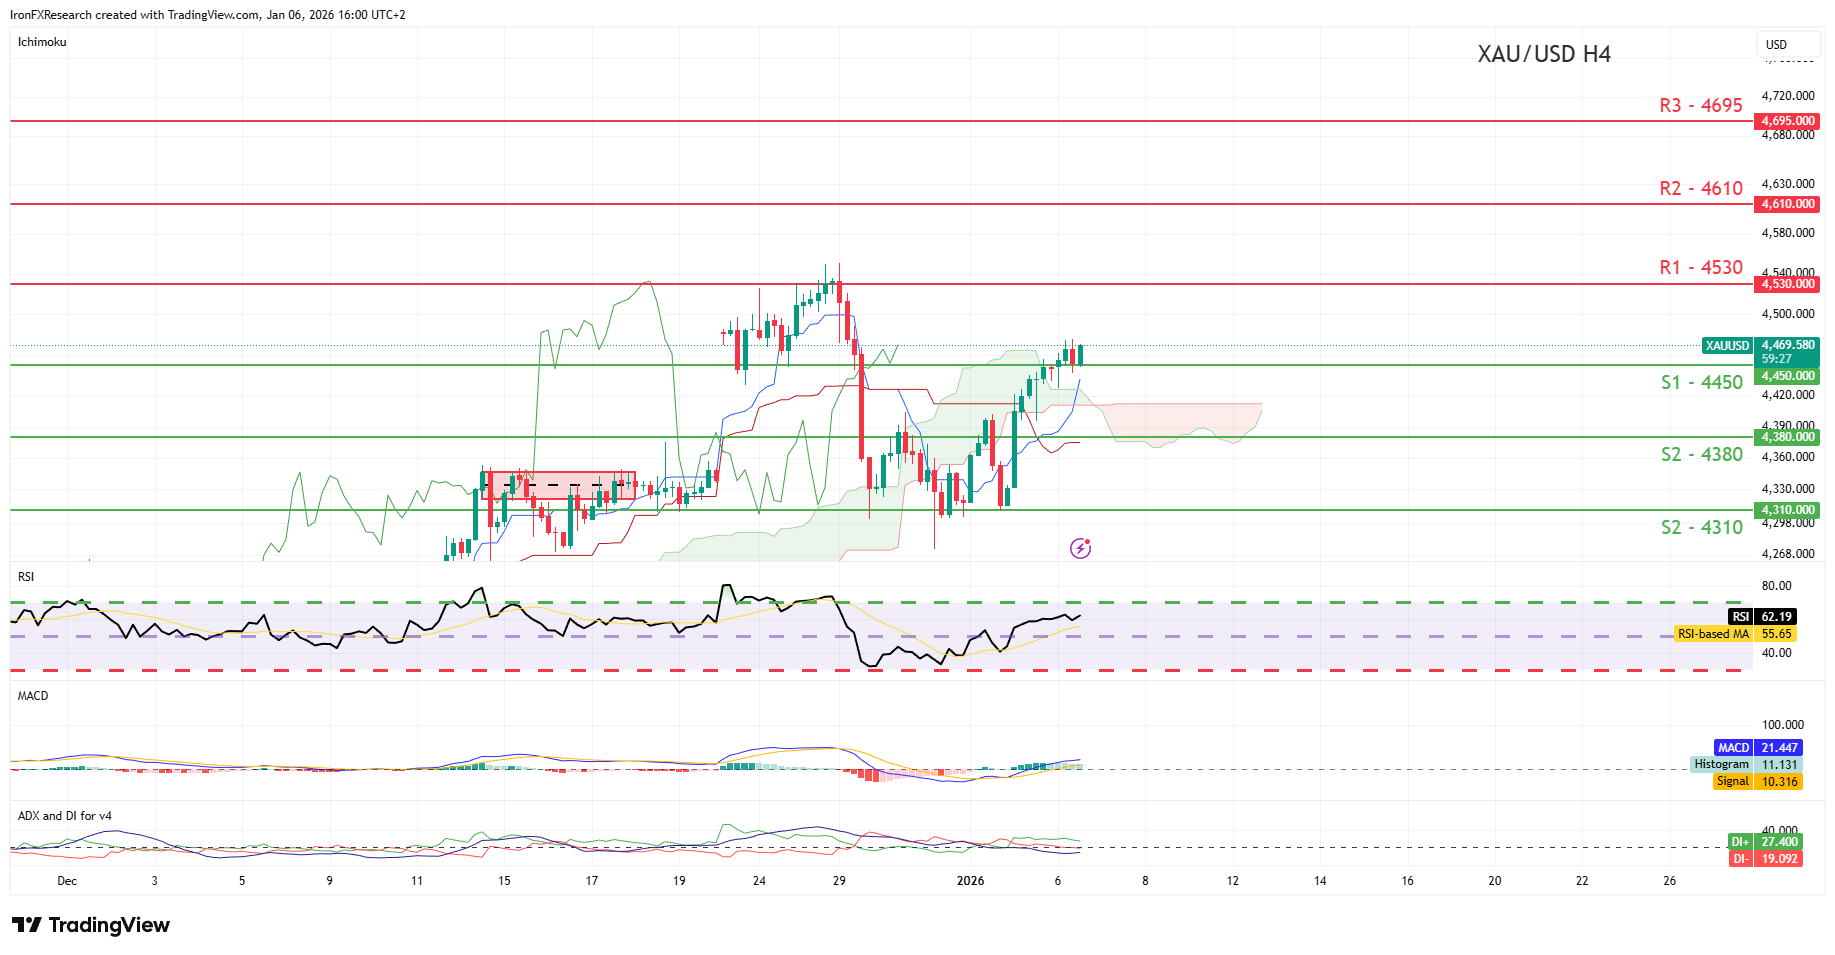
- Support: 4450 (S1), 4380 (S2), 4310 (S3)
- Resistance: 4530 (R1), 4610 (R2), 4695 (R3)
Since our last report, gold’s price appears to be moving higher after clearing our resistance now turned to support at our 4450 (S1) line. We opt for a bullish outlook for the precious metal’s price and supporting our case are all three indicators below our chart which tend to imply a bullish market sentiment.
For our bullish outlook to be maintained we would require a break above our 4530 (R1) resistance level, which coincides with gold’s ATH figure, with the next possible target for the bulls being our hypothetical 4610 (R2) resistance line.
On the other hand, for a sideways bias we would require gold’s price to remain confined between our 4450 (S1) support line and our 4530 (R1) resistance level. Lastly, for a bearish outlook we would require a clear break below our 4450 (S1) support level, with the next possible target for the bears being our 4380 (S2) support line.
Disclaimer:
This information is not considered investment advice or an investment recommendation, but instead a marketing communication. IronFX is not responsible for any data or information provided by third parties referenced or hyperlinked in this communication.