
Trump’s deadline nears pushing oil prices higher as markets grow increasingly nervous over rising geopolitical tensions surrounding Iran and the Straits of Hormuz.
With Iran showing no signs of backing down and fears of further escalation still present, oil supply concerns are once again driving bullish momentum in crude prices.
At the same time, investors remain cautious across global markets, while the USD continues to gain support amid hawkish signals from Fed officials.
Trump’s deadline looms pushing oil prices higher
US President Trump’s deadline on Iran to open the Straits of Hormuz is nearing increasing market uncertainty. The Iranian side seems to remain defiant and as these lines are written, a possible deal for a ceasefire seems remote.
Should we see further escalation in the war in Iran, given also the allready existing, shortage of oil supply, we may see oil prices rising further.
We also note that WTI’s price is higher than Brent’s in a rare signal, as the former has erased the premium usually attached to Brent’s price.
US stock markets remain cautious
US equity indexes were on the rise yesterday yet in today’s Asian session, tended to correct lower. The market seems to maintain a cautious stance given the uncertainty present. Despite some headlines about Amazon, Microsoft and Google facing environmental pressure for their data centres, we still view the war on Iran as the main issue for US equities currently.
The USD continues to gain
The USD continued to rise in the FX market, despite the ISM non-manufacturing PMI figure for March coming in lower than expected. Also, we note that Fed policymakers Goolsbee and Hammack expressed their concerns for inflationary pressures in the US economy in another signal of a hawkish predisposition on behalf of the Fed, which tends to be supportive for the USD.
Bitcoin’s price rose, yet no bullish outlook present
Bitcoin’s price was on the rise yesterday with reports citing an improvement of the market’s risk appetite. Also Strategy proceeded with Bitcoin purchases of $330 million in the past week which may be considered a positive. Nevertheless, we are still not convinced for the crypto’s bullish outlook, and a continuation of the crypto’s sideways motion seems more probable currently.
Other highlights for today
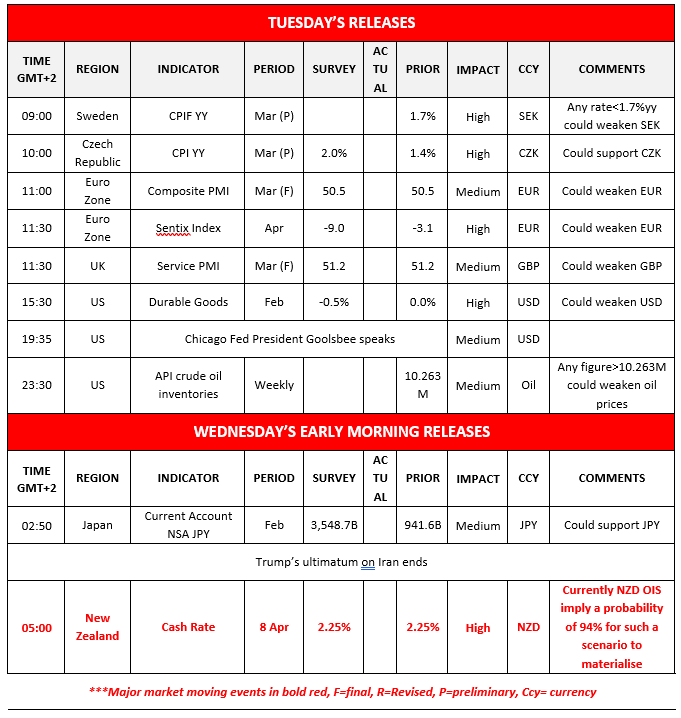
Today we get Sweden’s and the Czech Republic’s preliminary CPI rates for March, Euro Zone’s final composite PMI figure for March and the UK’s final services PMI figure for the same month, Euro Zone’s Sentix index for April, the US Durable goods for February, and the API weekly crude oil inventories.
On a monetary level, we note that Chicago Fed President Goolsbee speaks. In tomorrow’s Asian session, we get Japan’s current account balance for February and we highlight from New Zealand, RBNZ’s interest rate decision.
Charts to keep an eye out
WTI
WTI’s renewed its bullish movement breaking the 112.70 (S1) resistance line, now turned to support.
We maintain our bullish outlook for the commodity’s price action and note that the RSI indicator remains above the reading of 70, implying a strong bullish market sentiment for WTI’s price but also that the commodity’s price may be at overbought levels and ripe for a correction lower.
Should the bulls maintain control as expected we may see WTI’s price aiming if not breaking the 119.50 (R1) resistance line. Should the bears take over, we may see WTI’s price breaking the 112.70 (S1) support line continue to break the 107.00 (S2) support level, the upward trendline guiding the commodity’s price and reach if not breach the 100.90 (S3) level.
Dow Jones
Dow Jones despite being on the rise yesterday corrected lower in today’s Asian session, remaining well within the boundaries set by the 47150 (R1) and the 45750 (S1) levels.
Overall the index’s movement over the past week and yesterday allows us to maintain our bias for its sideways movement to continue.
Should the bulls take over, we may see index’s price action breaking the 47150 (R1) and start aiming for the 48350 (R2) level. Should the bears be in charge, we may see the index breaking the 45750 (S1) support line and start aiming for the 44580 (S2) support base.
WTI Daily Chart

- Support: 112.70 (S1), 107.00 (S2), 100.90 (S3)
- Resistance: 119.50 (R1), 127.00 (R2), 135.00 (R3)
US 30 Cash Daily Chart

- Support: 45750 (S1), 44580 (S2), 43320 (S3)
- Resistance: 47150 (R1), 48350 (R2), 49600 (R3)
Disclaimer:
This information is not considered as investment advice or an investment recommendation, but instead a marketing communication. IronFX is not responsible for any data or information provided by third parties referenced, or hyperlinked, in this communication.