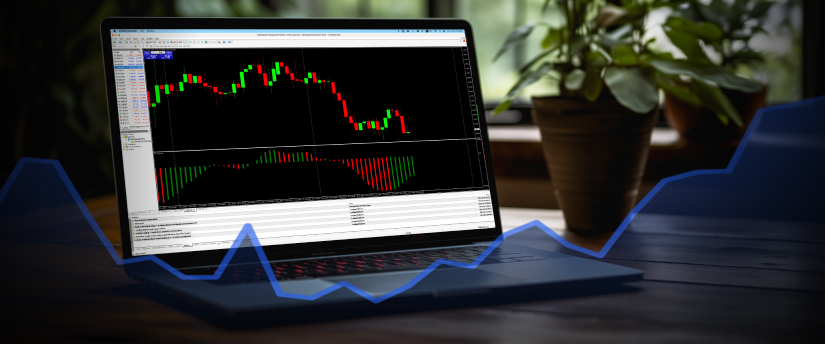
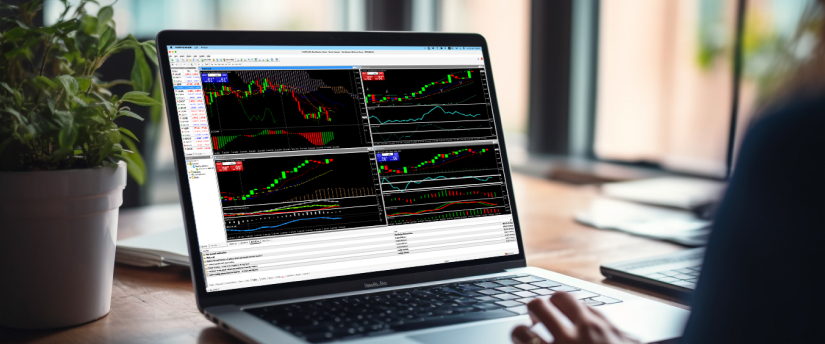
Metatrader 4 has over 30 indicators. That may not sound like a large number, but once you open the list of MT4 indicators and start deciding which one to add to your chart, you may start feeling a bit woozy.
For beginners, choosing from such a significant number of indicators, especially if you’re not 100% sure what each one does, is a daunting task. However, the good news is that you don’t need 30. Most traders don’t even need 10.
Your indicator choices depend on your trading style and preferences. While some are broadly used, others only serve to fill very specific niches. The trick isn’t memorising all 30 and knowing when to use each; it’s to take the handful of the ones you need and master them.
This article will cover the most common options that will allow you to start building your toolset.
Moving Average (MA) in MT4 Indicators
There isn’t a thing such as a universally useful indicator, but if something comes close, it’s the MA. Among MT4 indicators, Moving Averages help traders eliminate noise in price movement. They smooth out fluctuations and give traders a clean line instead. You can think of it as a modified line chart.
It works by taking a number of candles and drawing that line based on their closing prices. Of course, it’s an active indicator, so it also includes new price data.
Shorter period MAs (10, 20) react quickly to price changes. This makes them a great tool for revealing short-term trends. Longer-term MAs (50, 100, 200) move more incrementally and are great for grasping the bigger picture. Overall, they are great for understanding direction without getting bogged down by volatility.

The thing that makes MAs such a great generalist tool, especially for newer traders, is that they help locate trends, something most beginners struggle with. Of course, they aren’t exclusively a beginner tool, and some strategies get more mileage out of MAs than others.
Primarily, trend followers use MAs for obvious reasons. However, MAs also help locate pullbacks, helping swing traders locate entry points.
Practically, traders believe that MAs are somewhat magnetic. Within the family of MT4 indicators, if the price is above an MA, a downtrend is likely, and vice versa. Another common use is looking for the Golden Cross, when the 50- and 200-period MAs intersect. Traders use this as either a sign of reversal or a strong confirmation, depending on the direction.
If you’re someone who struggles with identifying trends, or whose strategy revolves around trends and reversals, you should strongly consider adding MAs to your favoured indicators.
Convergence et Divergence des Moyennes Mobiles (MACD)
What MAs are for trend direction, MACDs are for trend strength. Among the most popular MT4 indicators, MACD works on a similar idea to the Golden Cross we just mentioned, taking two Moving Averages (typically exponential ones, more weighted toward recent price data) and measuring their relationship. It then displays the gap as a rising or falling line, indicating a strengthening or weakening trend.
It also includes a Signal Line, which is a Moving Average for the MACD line. When these two lines intersect, traders consider it a strong entry signal.
While MACDs are less generally useful, they are still a valuable tool for traders who are entering late on a trend. It helps them confirm the momentum and avoid opening a position that will fizzle out almost immediately. Once again, this indicator is most useful for trend followers, because of its trend-related nature, and swing traders, due to its strong capability of predicting price turns.

The most common use of MACDs is to look for signal line crossovers. When it crosses above, bulls are likely in control, and if it crosses downwards, bears are taking over. Traders often also look for significant divergence between MACDs and price. If the price reaches a new high or low without the MACD following, the momentum may be weakening.
Relative Strength Index (RSI) in MT4 Indicators
RSI is a momentum oscillator. As one of the widely used MT4 indicators, it measures the speed and magnitude of recent price changes. Instead of analysing the broader trend, it focuses on the short term and shows whether an asset is overbought or oversold.
RSI moves from 0 to 100. Generally, when it goes above 70, it’s an indicator that an asset is overbought. Under 30 means it’s oversold. In stronger trends, these thresholds move to 80 and 20 respectively.
This indicator is primarily a tool for those who aim to capitalise on momentary movement. Scalpers use it to find micro-reversals, and reversal traders use it to find points where directional movement will exhaust. It’s also commonly used by range traders, as it oscillates smoothly between overbought and oversold levels, and provides signals for range-bound conditions.
The most basic way to use RSI is to look for the 70/30 marks. However, you should avoid doing so blindly, as strong trends can remain above or below those marks for extended periods. That’s why traders often use price structure, support/resistance, and MAs to verify RSI findings.
Bandes de Bollinger
Bollinger Bands help visualise volatility and are among the most recognisable MT4 indicators. They create an envelope around the price, consisting of three lines. The first is a Moving Average following the price, while the upper and lower bands sit a set number of standard deviations away from it. As volatility increases, the bands widen, and as it decreases, they contract.
Beginners may use Bollinger Bands to avoid volatile markets that they can’t yet navigate correctly. Contrary to that, volatility traders use them to find the volatility in which they thrive. Breakout traders seek tight bands, taking them as a sign of a possible incoming breakout, and mean-reversion traders look for prices that stray too far from the middle line, betting on a snap-back.
Beyond offering a current overview of the trading environment, Bollinger Bands can be used as a tool to predict volatility. For instance, when the price reaches an outer band, traders take it as a signal of an upcoming volatile period.
Oscillateur stochastique
The Stochastic Oscillator shows the strength of momentum by comparing current closing prices with the highs and lows of recent candles. It uses two lines: %K (the fast line) and %D, the slower and smoother line.
The idea behind the indicator is that if prices keep closing near the top of the recent range, the trend is strong, and if they close near the bottom, it’s weakening. As with many MT4 indicators, when the %K and %D lines cross, traders often interpret it as a sign of an upcoming reversal.
It’s most commonly used by range traders. It provides clean overbought and oversold readings within a range, making it easier to plan entries and exits. Additionally, scalpers use the quick-moving Stochastic Oscillator to locate the incremental momentum shifts they look for. Finally, reversal traders use it to find points where exhaustion sets in, and the trend may turn.
On a surface level, %K crossing %D below 20 is a buying signal, and above 80 is a selling signal. Traders also use divergence, which is when markets reach highs or lows, but the indicator fails to follow as a trend exhaustion signal.
However, the trick to using the Stochastic Oscillator properly is realising it’s more of a supportive indicator. Traders seldom use it alone. It works best in sideways markets, and strong trends can invalidate its findings. So, be sure to use patterns, support/resistance, and MAs to verify.
Apprenez des autres
This is far from an exhaustive list of MT4 indicators. However, it provides you with a solid starting point depending on your preferences. Start focusing on understanding the indicators that match your strategy, and your charts will immediately become less cluttered while offering clearer signals.
Avertissement : Ces informations ne doivent pas être considérées comme un conseil ou une recommandation d'investissement, mais uniquement comme une communication marketing. IronFX n'est pas responsable des données ou informations fournies par des tiers référencés, ou en lien hypertexte, dans cette communication.