War in Iran escalates further as military strikes on Iran’s strategic Kharg Island intensified tensions in the region, raising concerns about global energy supplies.
The island handles around 90% of Iran’s oil exports, making it a crucial hub for the country’s energy sector and a sensitive target in the conflict.
Following the strikes on military installations, fears grew that the escalation could threaten oil flows through the Strait of Hormuz, a key route for global oil shipments.
As a result, markets remain cautious, with oil prices rising and investors closely monitoring developments for potential disruptions to international energy supply.
War in Iran escalates further
The war in Iran escalated further with the bombing of Kharg Island, a purely economic target, as the majority of oil that Iran exports passes through there.
Despite the US targeting military installations, the signal of the Iranian oil supply line being endangered has been clear. Also the US is seeking an alliance of states to take control of the Straits of Hormuz, which could lead to further escalation.
Despite a slight correction lower in oil prices in today’s Asian session, should market worries about the supply side of the international oil market intensify we may see oil prices rising further, while the cautious market sentiment could continue to weigh on riskier assets such as US equities.
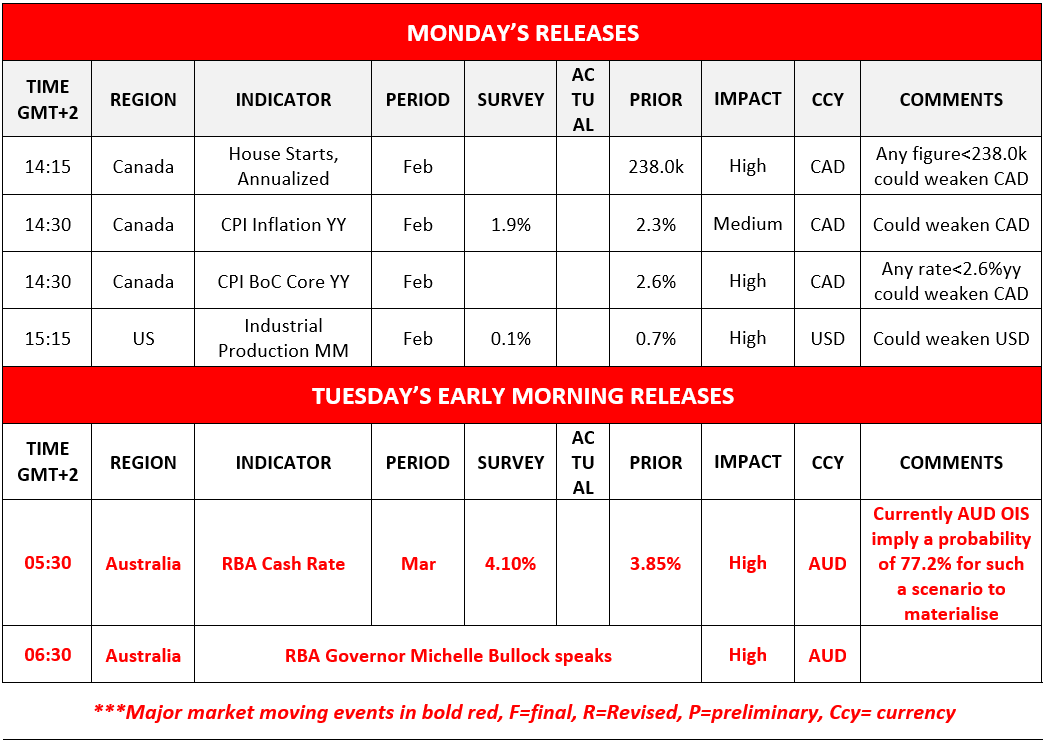
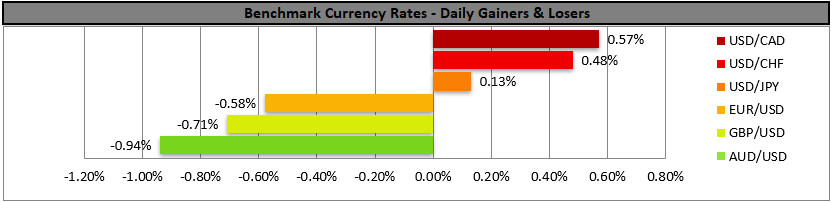
On the flip side, should market worries ease, we may see riskier assets gaining some ground while oil prices may slip. In the FX market, the USD continued to gain against its counterparts on Friday given its safe haven qualities, while attention is placed on RBA’s interest rate decision, which is expected to hike rates and should such a rate hike be accompanied also by a hawkish forward guidance, we may see AUD getting some support.
Also, we note the release of Canada’s CPI rates for February especially given the weak employment report for the same month released on Friday and given BoC’s interest rate decision coming Wednesday. Should Canada’s CPI rates slow down beyond market expectations we may see the Loonie losing ground.
Also, we highlight that the rise of Bitcoin in the crypto market is gathering momentum and could lead to further support for the crypto’s price action.
دیگر نکات مهم امروز
We also get February’s US Industrial Production yet the USD’s safe haven status may overshadow the release.
در مورد بقیه هفته
On Tuesday we get Germany’s ZEW indicators for March, on Wednesday we get Japan’s trade data for February, the US PPI rates also for February and the US Factory Orders for January and New Zealand’s GDP rate for Q4 25, while we highlight the release of the Fed’s interest rate decision in the US.
On Thursday, we get from Japan, BoJ’s interest rate decision and January’s machinery orders, Australia’s February employment data, UK’s employment data for January, the weekly US initial jobless claims figure and the US Philly Fed Business index for March.
On a monetary level we get from Switzerland SNB’s interest rate decision, Sweden’s Riksbank interest rate decision, UK’s BoE interest rate decision, from the Euro Zone ECB’s interest rate decision, and from the Czech Republic, CNB’s interest rate decision.
On Friday, we get from China PBoC’s interest rate decision, UK’s CBI indicator for industrial orders for March and Canada’s retail sales for January.
Charts to keep an eye out
WTI
WTI’s price continued to rise on Friday and during today’s Asian session, at some point even testing the 100.90 (R1) resistance line.
We intend to maintain our bullish outlook for the commodity’s price as long as the upward trendline guiding it remains intact, yet at the same time note that it remains in overbought territory and could correct lower.
Should the bulls maintain control over the commodity’s price action we may see it breaking the 100.90 (R1) line clearly and start aiming for the 107.00 (R2) level.
Should the bears take over, we may see WTI’s price reversing Friday’s gains and continuing to break also the 90.85 (S3) level.
BTC/USD
BTC/USD edged higher and during today’s Asian session, broke the 72500 (S1) resistance line, now turned to support.
Given also that the RSI indicator is on the rise, above 50, implying a strengthening bullish market sentiment for the crypto king, we switch our sideways motion bias in favour of a bullish outlook.
Should the upward movement be continued as expected, we may set as the next possible target for the crypto’s bulls the 81160 (R1) resistance line.
Should the bears take over, we may see BTC/USD reversing the gains made, breaking the 72500 (S1) support line and starting to aim for the 65000 (S2) support level.
BTC/USD Daily Chart

- Support:72500 (S1), 65000 (S2), 60000 (S3)
- Resistance: 81160 (R1), 88000 (R2), 97900 (R3)
WTI Daily Chart

- Support: 97.35 (S1), 93.90 (S2), 90.85 (S3)
- Resistance: 100.90 (R1), 107.00 (R2), 112.70 (R3)
سلب مسئولیت:
این اطلاعات به عنوان مشاوره سرمایه گذاری یا توصیه سرمایه گذاری در نظر گرفته نمی شود ، بلکه در عوض یک ارتباط بازاریابی است. IronFX هیچ گونه مسئولیتی در قبال داده ها یا اطلاعاتی که توسط اشخاص ثالث در این ارتباطات ارجاع و یا پیوند داده شده اند ندارد.