
WTI appears to be continuing it’s downwards path at the time of this report. In today’s report we are to have a look at the recent announcement by the US that India may halt purchases of Russian oil, the ongoing tensions between the US and Venezuela and lastly the ongoing trade spat between China and the US, all of which could affect oil prices. The report is to be concluded with a technical analysis of WTI’s daily chart for a rounder view.
India pledges to halt Russian oil imports, Trump says
One of the most prevailing developments in the oil markets is President Trump’s announcement that India’s Prime Minister has promised that they will halt Russian oil imports. Specifically, President Trump stated that “I was not happy that India was buying oil, and he assured me today that they will not be buying oil from Russia”, referring to a phone call he had with Prime Minister Modi on Wednesday.
The statement by President Trump could influence oil prices in the near term considering that India is one of Russia’s largest oil buyers and thus a decision to halt Russian oil imports could result in a reduction of the supply into the global oil markets, which in turn may aid oil prices.
However, New Delhi in response to President Trump’s announcement has apparently refused to confirm the comments made by the US President, which tends to raise questions as to how committed they are to halting Russian oil imports. From our perspective, we see the case for New Delhi to appease the US President by agreeing to reduce their oil imports from Russia, yet the question remains as to how far that may go.
Moreover, considering Russia’s extensive shadow fleet of oil tankers, could a possible halting of Russian oil imports be superficial in nature?. Those questions remain unanswered at this point in time and thus we are eager to see as to how this particular situation plays out.
However, from a market perspective should it appear that India may be truly halting Russian oil imports it could possibly aid oil prices. Whereas, should the process be dragged out or even denied by India the market could assume that it’s business as usual, which in turn may fail to materially influence oil prices.
Venezuela regime change inbound?
Venezuela and the US are still not on the friendliest of terms with President Trump confirming this week that he had authorized CIA activities within Venezuela. Furthermore, when asked about the statement, the US President replied by stating that he authorized the CIA to operate for two reasons, with the first one being due to Venezuela having “emptied their prisons into the United States of America” and the second “ and the other things are drugs”.
In our opinion, the CIA conducting operations in Venezuela is not a surprise considering the large-scale military buildup by the US in the region, but the Commander in Chief’s confirmation that he authorized operations to occur is a very public statement and what surprised us the most.
We should note that there have not been talks about a possible regime change, yet considering what we know the US could proceed with such an avenue if they wished to do so. Overall, should a military conflict occur in the region, Guyana who is Venezuela’s neighbour and a large oil exporter could be dragged into the conflict considering Venezuela’s territorial ambitions in the Essequibo region. Hence, any military conflict could possibly aid oil prices.
US-China trade spat moves into the shipping world
The US’s and China’s very public trade spat has moved into the shipping world. For context, on the 14th of October, U.S authorities begun charging ships of Chinese owners or operators $50 per net tonne of goods they bring to American ports, with China’s countermeasures being 400 yuan or roughly $56 per net tonne which also came into play on the 14th of October.
Hence the ongoing maritime battle between the world’s largest economies could increase manufacturing costs and may dampen manufacturing activity should the maritime spat be prolonged. Hence, a possible dent in manufacturing could result in a reduction for demand of oil and may thus weigh on oil prices in the future depending on how long this plays out.
Oil Technical Analysis
WTI Cash Daily Chart
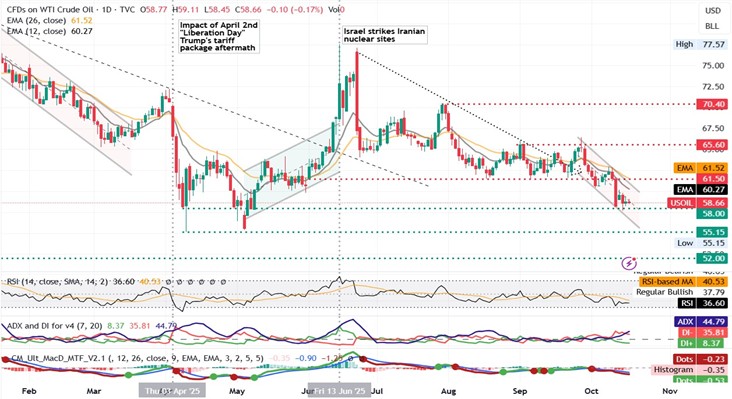
- Support: 55.25 (S1), 51.95 (S2), 49.10 (S3)
- Resistance: 58.90 (R1), 61.75 (R2), 64.50 (R3)
Since our last report the WTI appears to have moved lower. We opt for a bearish outlook for the commodity and supporting our case are all three indicators below our chart which tend to showcase a bearish market sentiment. Specifically, the RSI indicator being close to 30, the MACD and ADX where the -DI is greater than the +DI.
Moreover, on our chart we are also using the Ichimoku indicator which tends to support our bearish outlook. For our bearish outlook to be maintained we would require a break below our 55.25 (S1) support level with the next possible target for the bears being our 51.95 (S2) support line.
On the flip side for a bullish outlook we would require a clear break above our 58.90 (R1) resistance line with the next possible target for the bulls being our 61.75 (R2) resistance line. Lastly, for a sideways bias w would require the commodity’s price to remain between our 55.25 (S1) support level and our 58.90 (R1) resistance line.
إخلاء المسؤولية:
This information is not considered investment advice or an investment recommendation, but instead a marketing communication. IronFX is not responsible for any data or information provided by third parties referenced or hyperlinked in this communication.